A drawdown is ordinary variance unless the character of the losses has changed. A strategy with a 45% win rate produces seven consecutive losses about once in 62 sequences — expected, not diagnostic. Four questions separate variance from failure: has the average loss grown, has the win rate moved over a large sample or only the sequencing, are the same setups still being traded, and has the market regime changed. Variance calls for continuing at the same size; failure calls for stopping and reviewing.
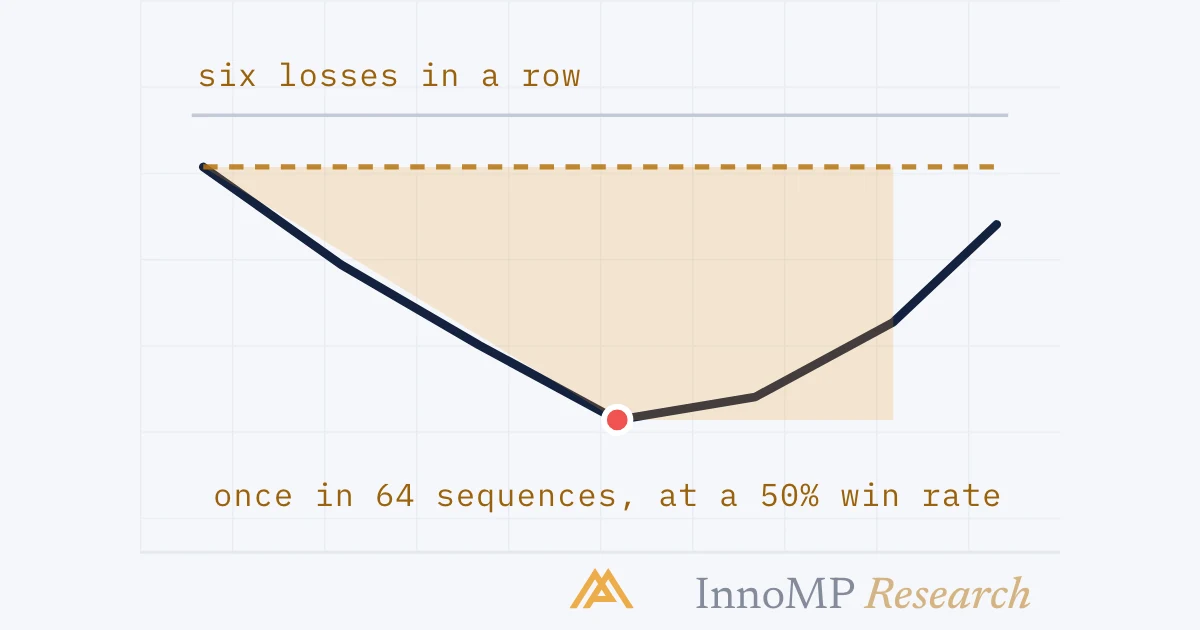
A strategy that wins 50% of the time will produce a run of six losses roughly once every sixty-four sequences. Not as a malfunction — as arithmetic. Traders who do not know this abandon workable approaches during ordinary variance, and, more expensively, keep trading approaches that have genuinely stopped working because “it is just a drawdown”.
Distinguishing the two is a skill, and it is mostly a matter of asking better questions than “am I down?”.
What variance actually looks like
For a strategy with a 45% win rate, streaks are unremarkable:
| Consecutive losses | Roughly how often |
|---|---|
| 3 | 1 in 6 sequences |
| 5 | 1 in 19 |
| 7 | 1 in 62 |
| 10 | 1 in 370 |
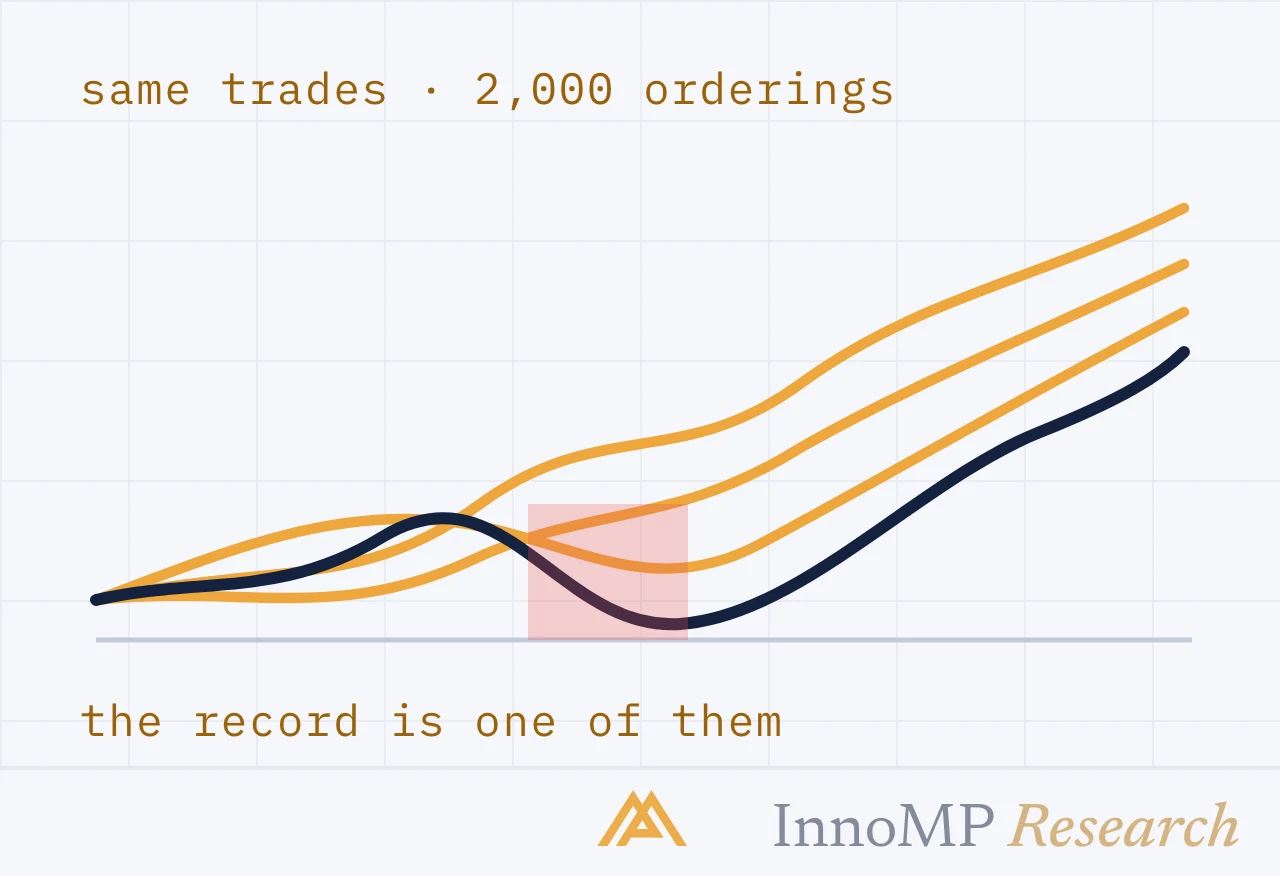
A seven-loss streak in a strategy you have traded for two hundred trades is expected, not diagnostic. The instinct to intervene is strongest exactly when the evidence supports it least.
Key takeaway A losing streak is information about variance. A change in the character of losses is information about the strategy. Only the second justifies a change.
Four diagnostic questions
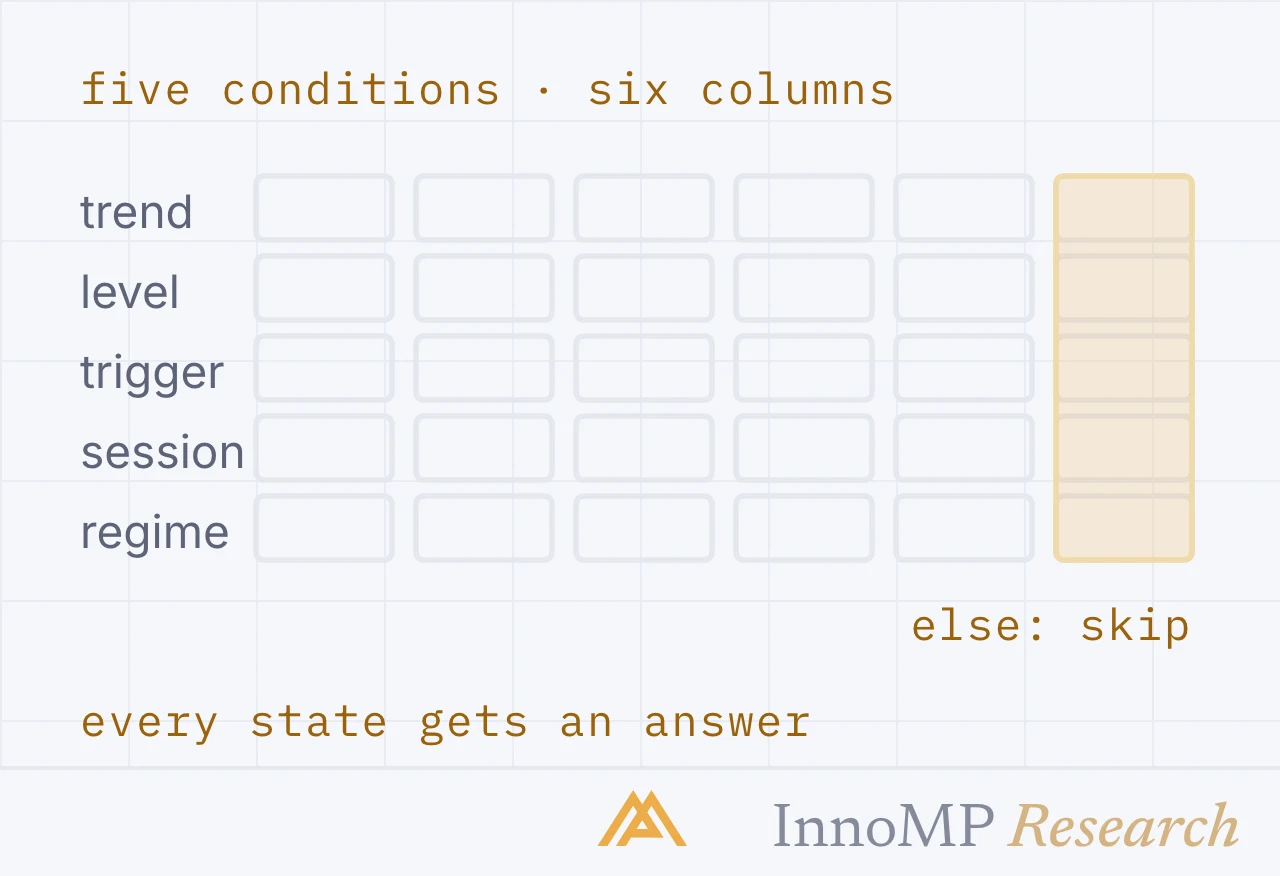
Has the average loss changed? A strategy in ordinary variance loses about what it always lost, more often. A broken one loses more per trade — usually because stops are being crossed rather than touched, or because conditions changed and the stop distance no longer suits them.
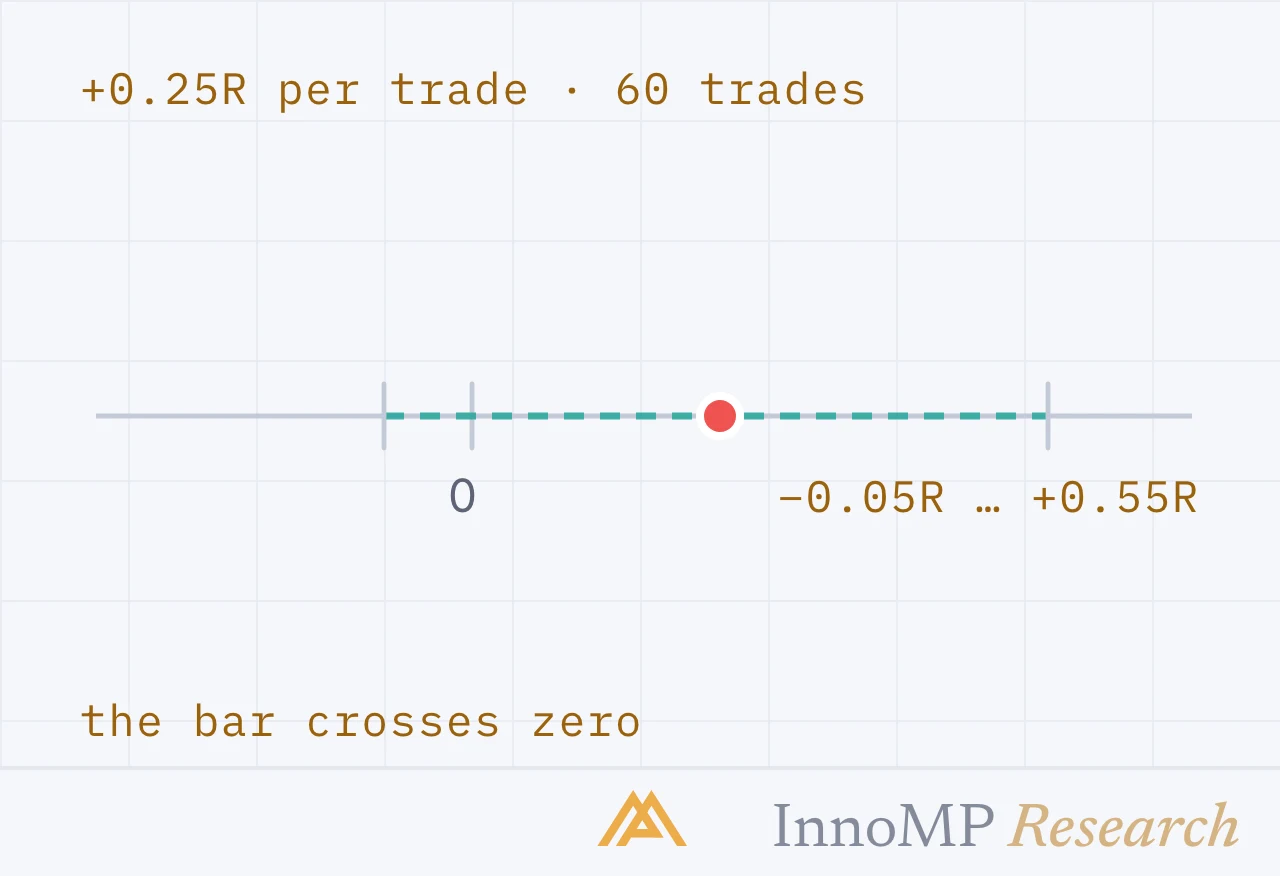
Has the win rate moved, or just the sequencing? Twelve wins in forty trades is roughly the same rate as three in ten. Clustering feels catastrophic and means nothing. A genuine deterioration shows up across a hundred trades, not fifteen.
Are you trading the same setups? This is where most “broken strategies” actually break. Drawdowns produce loosened criteria — a setup that is nearly right, a level that is close enough. The strategy did not stop working; it stopped being traded.
Has the market regime changed? A range-trading approach in a newly trending market is not broken, it is out of season. A trend-following approach in a compressed range is the same story. Regime change is real, identifiable, and not a reason to redesign the system.
The distinction that matters
Variance shows: normal-sized losses, unchanged setups, unchanged win rate over a meaningful sample, recognisable market conditions.
Genuine failure shows: losses larger than designed, drifting entry criteria, degradation sustained over a large sample, or a market environment the approach was never built for.
The first calls for continuing at the same size and doing nothing else. The second calls for stopping and reviewing — not for adjusting mid-drawdown, which is how a diagnostic problem becomes a capital problem.
The rules worth setting in advance
Decide these while you are not in a drawdown, because the decision cannot be made honestly from inside one:
A review threshold. A percentage decline at which you stop and examine rather than continue. Not a number that triggers redesign — one that triggers reading your own records.
A size-reduction rule. Many traders halve position size at a defined drawdown level. It slows recovery and it also makes the strategy survivable long enough to recover at all.
A minimum sample. Commit to not judging a strategy on fewer than a set number of trades. Whatever the number, choosing it beforehand prevents the far commoner error of judging on twelve.
Recording it while it happens
Keep a record through the drawdown: each trade, whether it met the criteria, the market conditions, and what you felt like doing.
That last column is the valuable one. Reviewed later, it usually reveals that the largest losses came not from the strategy but from the trades taken around it — the size increase to recover faster, the setup that was nearly right, the position held past its stop because it had to come back.
Those are the trades that turn a drawdown into a failure, and they are visible in advance only to someone who has written them down before.
- At a 45% win rate, three consecutive losses occur about once in 6 sequences, five in 19, seven in 62 and ten in 370.
- A losing streak is information about variance; larger-than-designed losses are information about the strategy.
- Most broken strategies are strategies that stopped being traded as written, with loosened entry criteria during the drawdown.
- A review threshold, a size-reduction rule and a minimum sample size should be set before a drawdown, not inside one.
- Judging a strategy on fewer than a pre-agreed number of trades is the commonest drawdown error.