Market structure
How to trade US100 CFDs: a framework for the Nasdaq-100
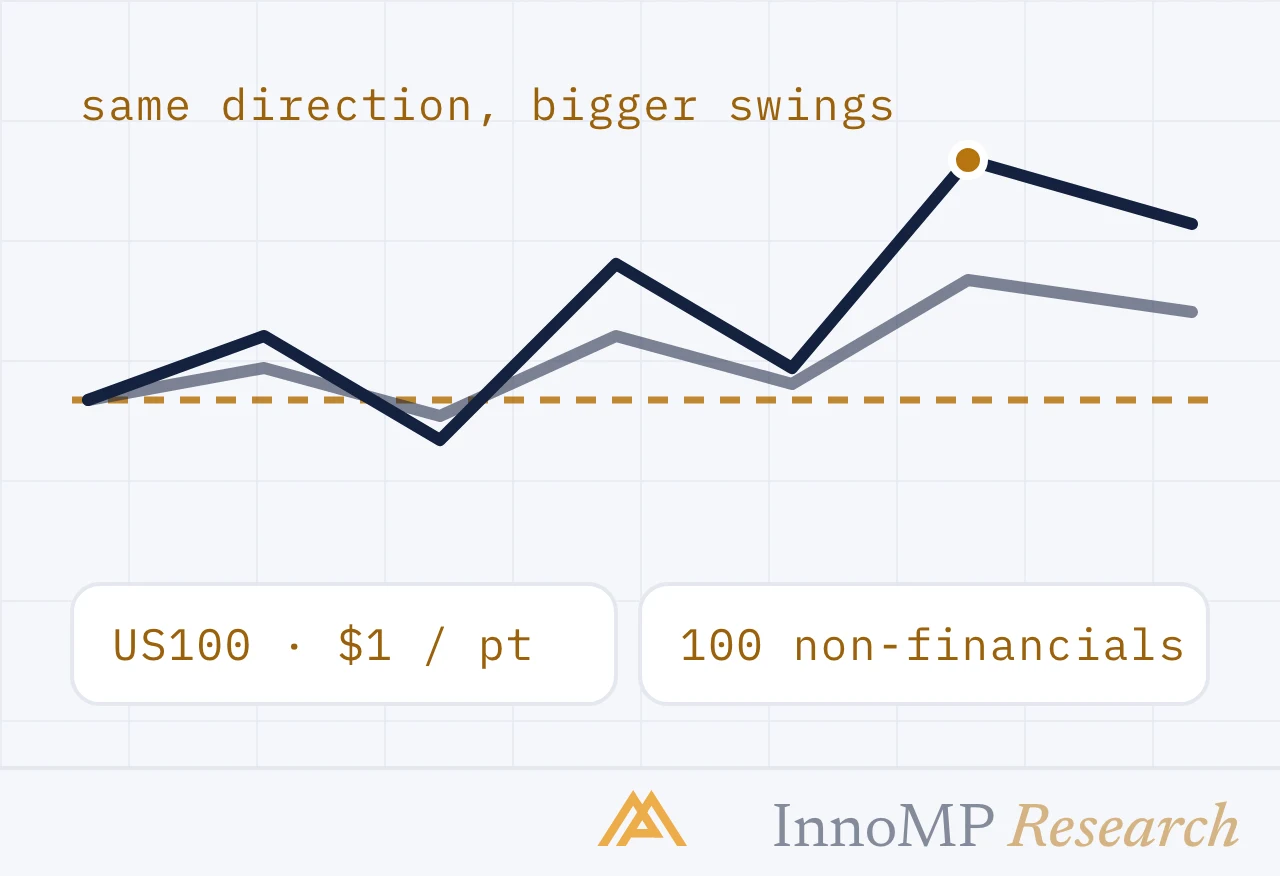
Same direction as the S&P 500, bigger swings. Why the Nasdaq-100 moves more, how concentrated it may be, the one-contract lot, and sizing at a higher level.
9 min read
Six courses in reading order — CFD foundations, technical analysis across three levels, trading psychology, and instrument-by-instrument guides. Start where you are.
What a CFD is, what a trade costs, and the arithmetic that decides whether a losing run is survivable. Read before the technical analysis course.
What charts record, market structure, candlesticks, the classic patterns and the core indicators. No prior knowledge assumed.
Level 2 of 3. Assumes the Foundations course — structure, patterns and the core indicators — and puts the pieces together into a setup you can repeat.
Level 3 of 3. Assumes Foundations and Intermediate — a written setup and a record. This level is about the machinery under the price, the statistics that judge the record, and turning a process into a system.
Applies at every stage — read alongside the technical analysis levels.
One guide per instrument — what moves it, the contract, the sessions that matter, and how to size for it. Assumes CFD Foundations.
Same direction as the S&P 500, bigger swings. Why the Nasdaq-100 moves more, how concentrated it may be, the one-contract lot, and sizing at a higher level.
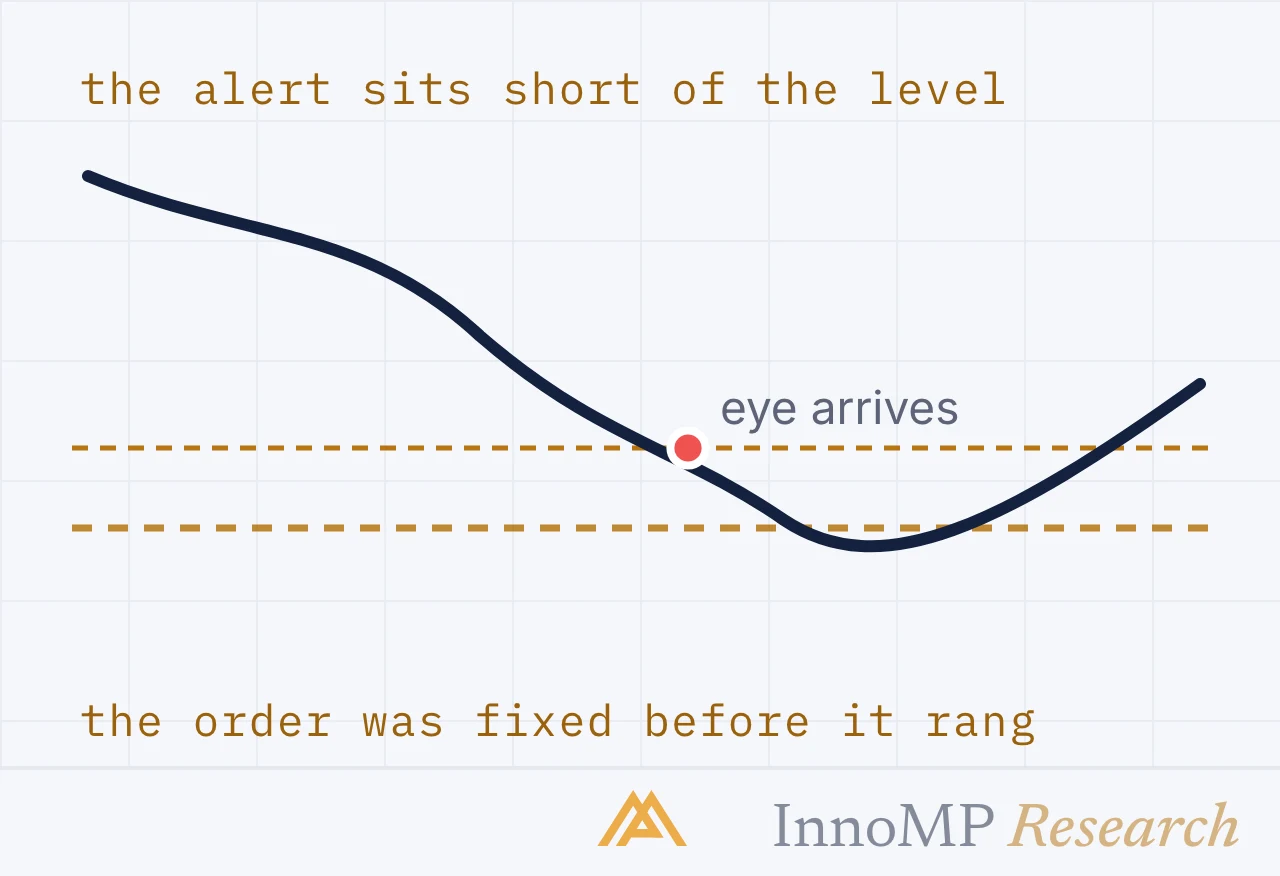
A decision table is as good as the moment it is consulted. How to split its conditions into what an alert can watch and what needs the eye, fix the order by rule, and know what still runs when the screen is off.
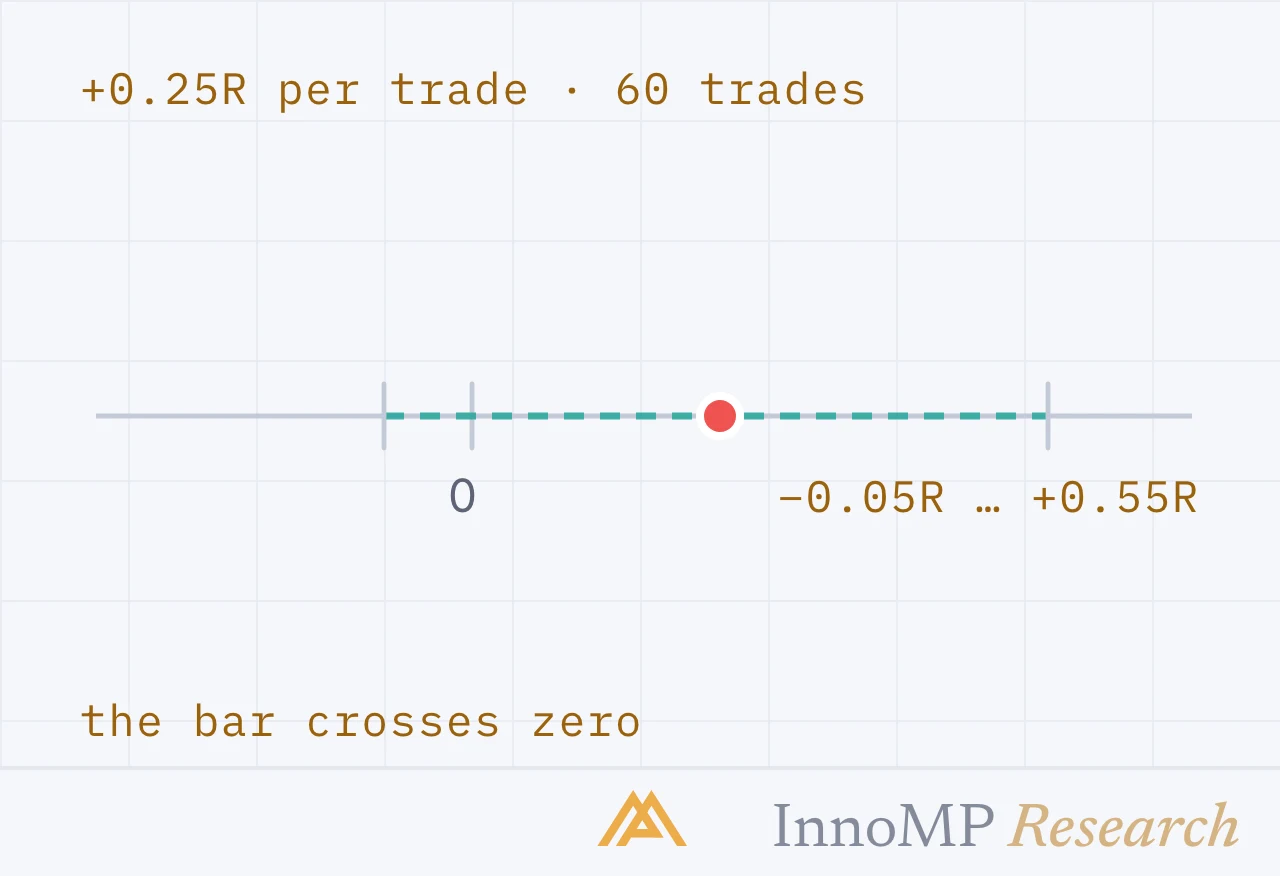
A record says +0.25R per trade. The question is how far from that the truth could be. How to put a standard error and a confidence interval on expectancy, and how many trades it takes to tell an edge from zero.
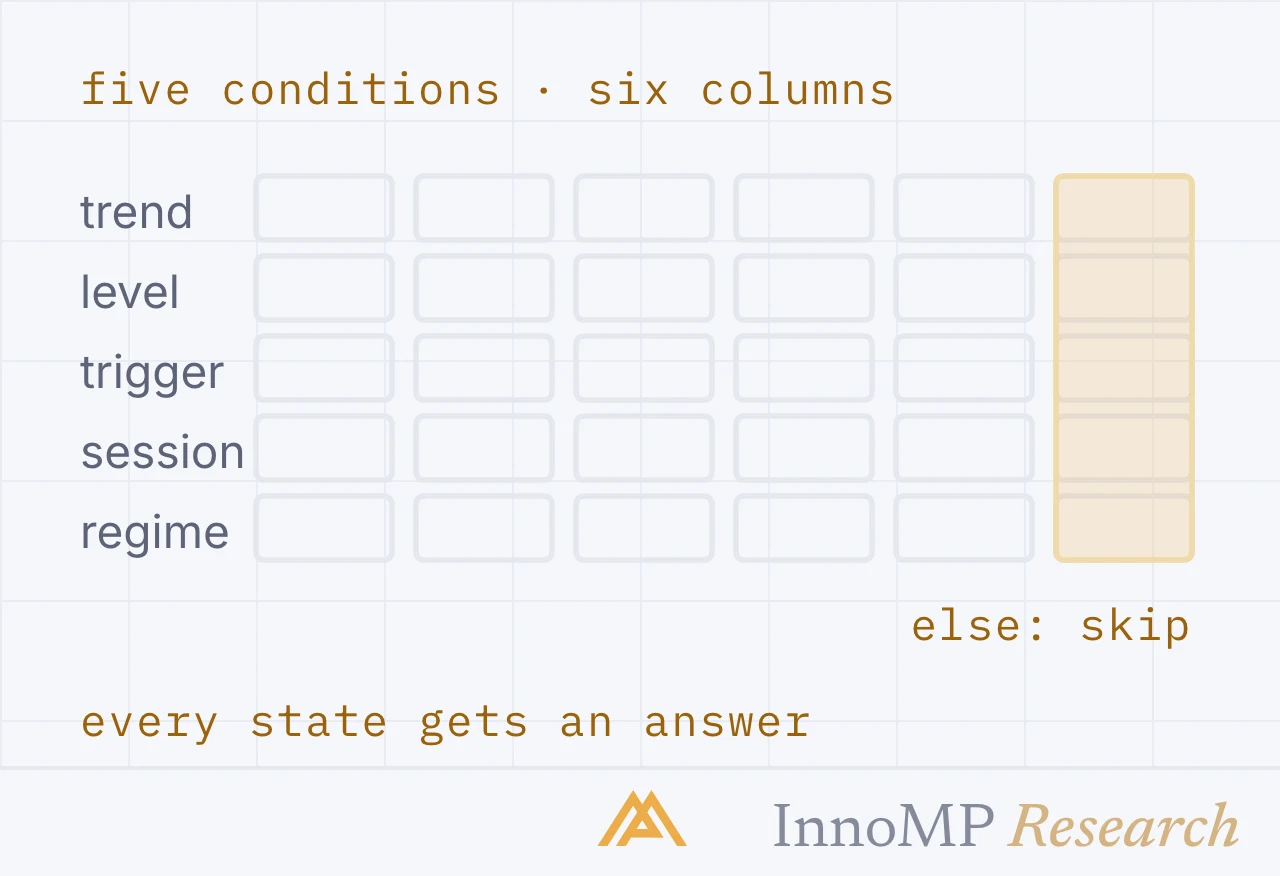
A written setup still leaves gaps: market states its prose never mentioned. How to lay the rules out as a decision table — conditions down the side, a column per rule — and find the gaps and contradictions first.
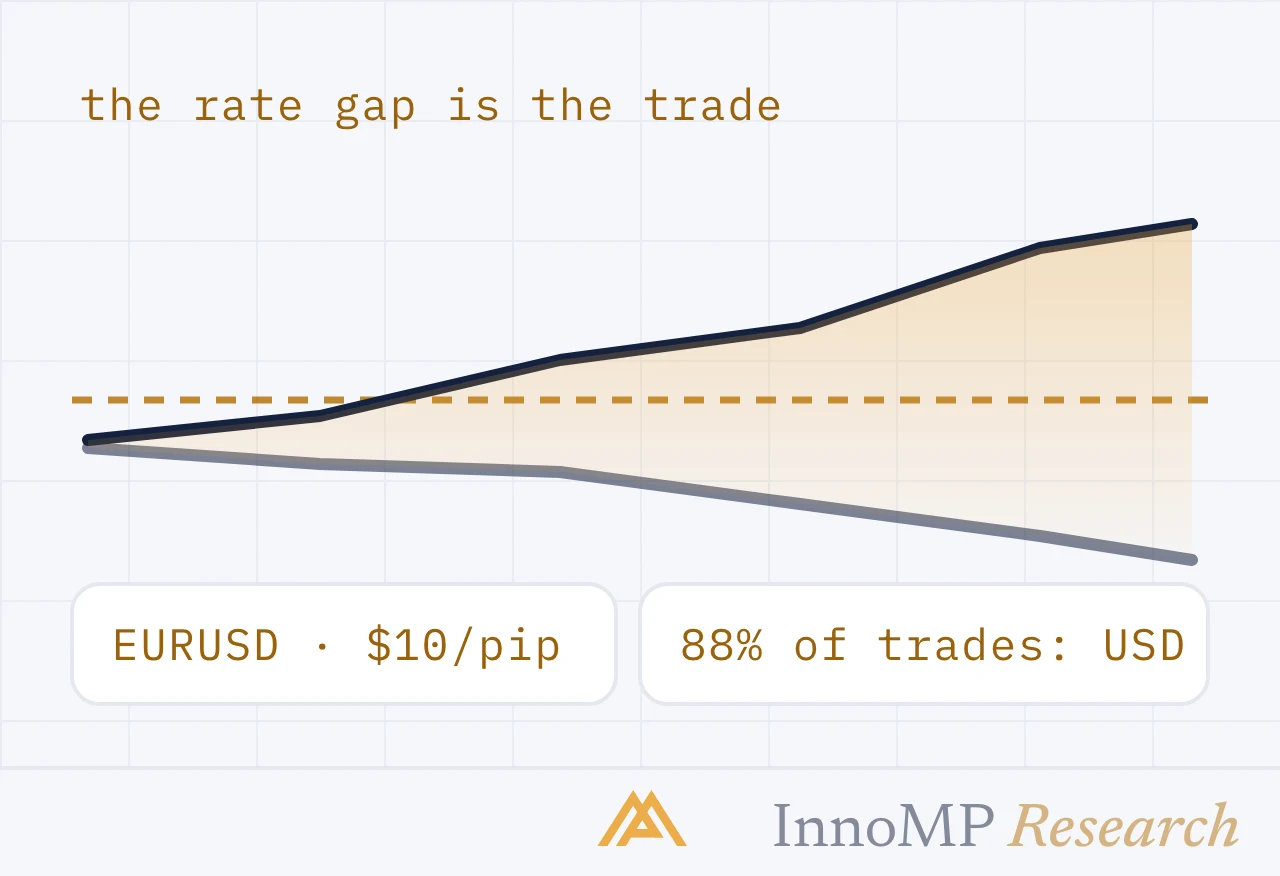
The dollar is on one side of 88% of currency trades, the euro on 30%. What moves EURUSD, the contract, the two central banks, and sizing for a liquid pair.
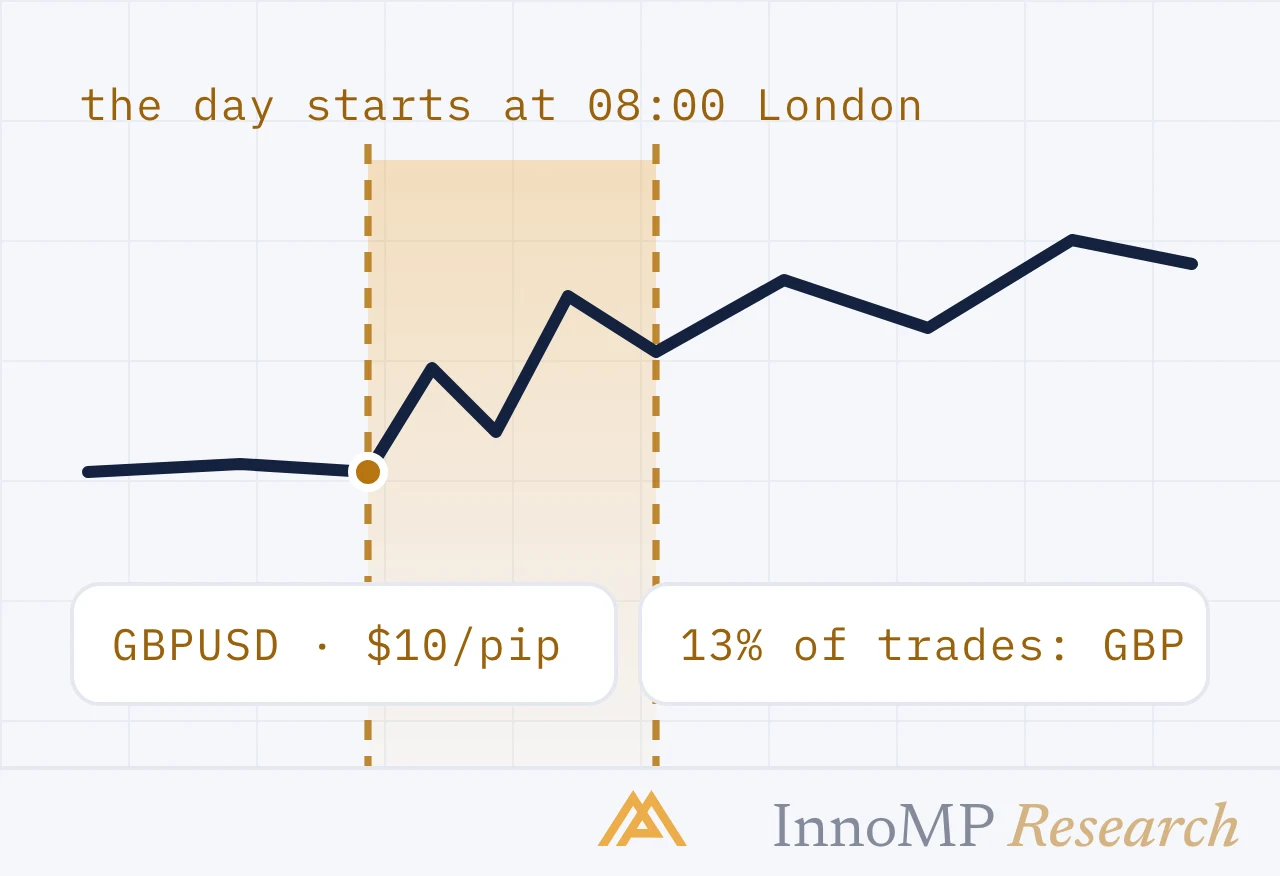
The fourth most traded currency, a day that starts at 08:00 London, a 07:00 inflation print into a thin book, a noon Bank of England. Drivers, contract, sizing.