Skip to content
Research / Education / Cognitive bias

Trading Psychology · Part 4 of 20

Recency and availability: why the last three trades feel like the whole picture

Recent and vivid events dominate judgement out of proportion to their weight. What that does to strategy assessment, and the sample sizes that actually mean something.

InnoMP Research Published 31 Aug 2026 · Updated 31 Aug 2026 6 min read
In short

Recency bias is the tendency to weight recent events more heavily than older ones; availability bias is the tendency to judge likelihood by how easily examples come to mind. Together they make a handful of recent or memorable trades feel representative of a strategy's overall performance, which leads traders to abandon working methods and adopt failing ones on samples far too small to be meaningful.

Recency bias weights recent events too heavily. Availability bias judges likelihood by how easily examples come to mind. They are separate mechanisms that produce the same trading error: treating a tiny, unrepresentative sample as though it described reality.

The arithmetic of streaks

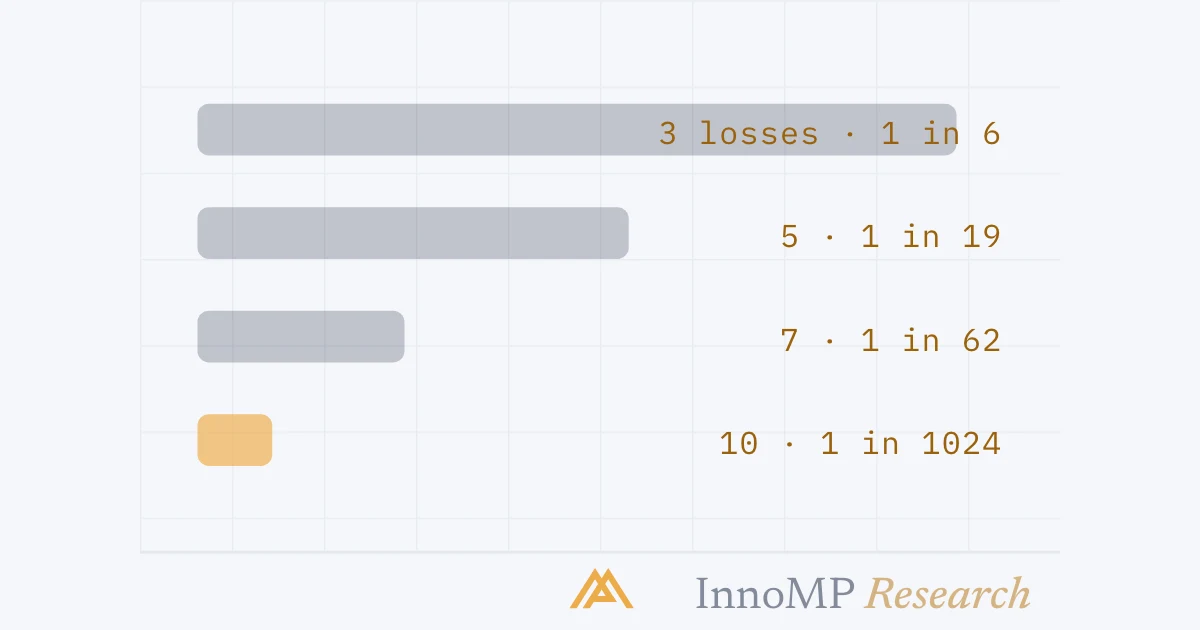
Traders consistently underestimate how ordinary losing runs are. For a strategy winning 45% of the time:

How often consecutive losing runs occur for a 45 percent win rate Four horizontal bars of decreasing length showing the frequency of losing streaks: three losses about one sequence in six, five losses one in nineteen, seven losses one in sixty-two, ten losses one in three hundred and seventy. 3 losses1 sequence in 65 losses1 in 197 losses1 in 6210 losses1 in 370 InnoMP Research
Five losses in a row is not a signal. Across two hundred trades it happens several times, by construction.

Five losses is more than enough to convince most traders that something has broken — because five recent losses are vivid, immediate, and all the mind has readily available.

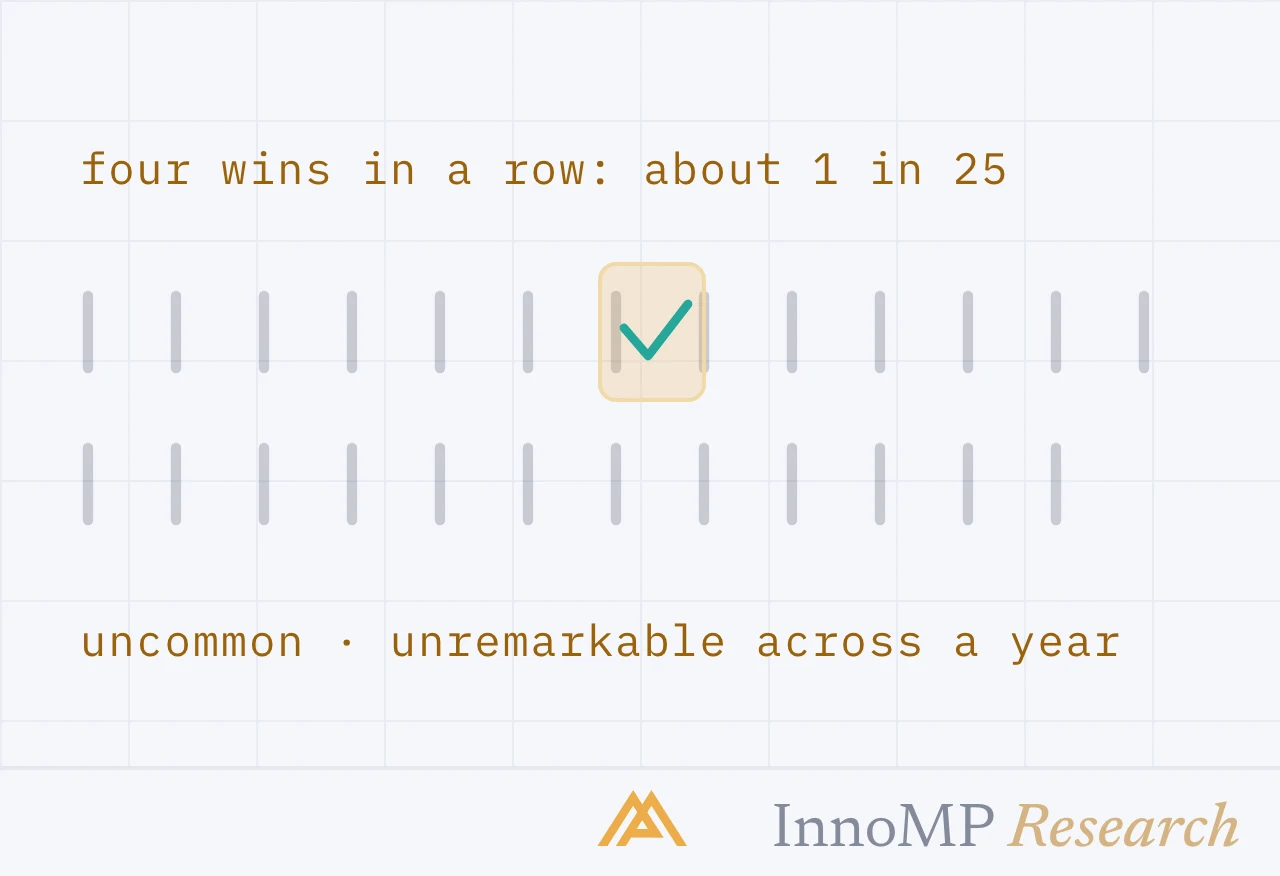
The corollary is worse: the same bias operating on wins produces the conviction that a strategy is excellent after four good trades, which arrives just in time to justify increasing size.

The fragment against the whole

A short losing window inside a rising hundred-trade equity curve A rising equity curve over a hundred trades. A short segment of six declining trades in the middle is boxed with a dashed outline, showing a fragment that looks like failure sitting inside a curve that is clearly working. equitywhat you rememberwhat actually happened63 trades, average +0.3R InnoMP Research
The boxed stretch is what recency shows you. The full curve is what the journal shows you. They are the same strategy.

Availability: the loss you cannot forget

Availability bias runs on vividness rather than recency.

One vivid loss recalled instantly against two hundred ordinary trades recalled as a blur A large distinct block representing a single memorable four percent loss beside a wide band of small faint marks representing two hundred ordinary trades, with a note that the felt probability is far higher than the actual frequency. one weekend gap−4%, recalled in detail200 ordinary tradesrecalled as a blurfelt probability of catastrophe:far higher than the real frequency InnoMP Research
One memory sets the felt probability. The two hundred trades around it contribute almost nothing to the estimate.

This distorts in both directions and neither is helpful — refusing a valid setup because it resembles one memorable disaster, or miscalibrating risk based on which outcome is easier to picture.

Note that the vivid event may still deserve a response. A weekend gap is a genuine risk that deserves structural handling. The bias is not in taking it seriously — it is in letting one memory set the size of every subsequent position.

What actually counts as evidence

Sample size thresholds for judging a strategy A horizontal scale divided into three regions by trade count. Below thirty is labelled variance, thirty to a hundred is labelled a weak signal, and a hundred or more is labelled meaningful, with a note about what each supports. < 30 tradesvariance — no conclusion30–100worth reviewing, not restructuring100+ · win rate reflects the method InnoMP Research
Set the threshold before you need it. Deciding it during a five-loss streak is not a decision — it is a negotiation with discomfort.

This is why reading a drawdown insists on asking whether the character of losses changed rather than whether losses happened. Character is visible in small samples; edge is not.

Key takeaway Set the review threshold before you need it. Deciding in advance that you will not judge a strategy on fewer than 50 trades is a decision you can make rationally. Deciding it during a five-loss streak is not a decision — it is a negotiation with discomfort.

A feeling about five trades against a number from sixty-three Two panels. The left shows five recent losing trades filling the whole frame under the word collapse. The right shows the same five inside a set of sixty-three trades with an average of plus zero point three R. What it feels like”collapse”What the journal says5 losses in 63 tradesaverage +0.3Rthe journal records what memory cannot:the trades that were not memorable InnoMP Research
Not feeling differently about recent losses — having a number that outranks the feeling.

The journal as memory replacement

Both biases are failures of recall, so the fix is to stop relying on recall.

A journal that records every trade in R-multiples gives you the actual distribution instead of the memorable fragment. When five losses feel like collapse, the journal shows 5 losses inside 63 trades with an average of +0.3R — and the feeling loses its authority.

That substitution is the entire technique. Not feeling differently about recent losses, but having a number that outranks the feeling.

Next: Overconfidence and luck — the same distortion running in the profitable direction, where it does more damage.

Key facts
  • A 45%-win-rate strategy produces a five-loss streak roughly once in every nineteen sequences.
  • Judging a strategy on fewer than about 30 trades measures variance rather than edge.
  • Vivid losses are recalled more easily than ordinary ones, distorting perceived risk.
  • A written journal counters both biases by replacing recall with a record.
Frequently asked questions

What is recency bias in trading?

The tendency to give recent results more weight than they deserve. After three losses a trader may conclude a strategy has stopped working, when a three-loss run is an ordinary occurrence for almost any strategy.

How many trades do I need before judging a strategy?

At least 30 to see anything meaningful, and closer to 100 for reasonable confidence. Below that, results are dominated by variance — the same strategy can appear excellent or broken depending on which stretch you happen to look at.

What is availability bias?

Judging how likely something is by how easily examples come to mind. A single dramatic loss is recalled far more readily than twenty ordinary ones, so it distorts your sense of how risky a setup actually is.

How do I counter recency bias?

Keep a written record and review aggregates rather than recent memory. A journal showing 60 trades with win rate and average R makes the last three trades take their correct proportional place.

InnoMP Research

Market research, trading education and platform guides from the InnoMP research desk — covering forex, metals, indices and stock CFDs.

Published 31 Aug 2026 · Updated 31 Aug 2026 · Reviewed by InnoMP Compliance

Disclaimer: This content is provided for general informational purposes only and does not constitute investment advice, an offer, or a solicitation to buy or sell any financial instrument. It has been prepared without regard to your individual financial circumstances or objectives. Trading CFDs involves a high risk of loss.

Related notes