Risk-reward ratio compares the distance from entry to target with the distance from entry to stop: entry 1.0800, stop 1.0780, target 1.0860 risks 20 pips to pursue 60, a 1:3 trade. The ratio only means something next to the win rate — a 1:2 strategy breaks even at a 33% win rate, a 1:1 strategy at 50%. It is gamed in two ways: a target placed to flatter the ratio, and a stop widened under pressure. Recording results in R-multiples keeps both honest.
Risk-reward ratio is the most quoted number in trading education and among the most misused. The concept is genuinely load-bearing — it connects win rate to profitability and makes a journal speak clearly — but it only works when both of its inputs are honest, and one of them usually is not.
What the ratio is
Before entry, a planned trade has three prices: entry, stop, and target. The ratio compares the two distances:
Risk-reward = (target − entry) ÷ (entry − stop)
Entry at 1.0800 with a stop at 1.0780 and target at 1.0860 risks 20 pips to pursue 60: a 1:3 trade. Expressed in money via the pip value calculator and the position size calculator, that is risking one unit to pursue three.
Why it matters: the arithmetic of pairs
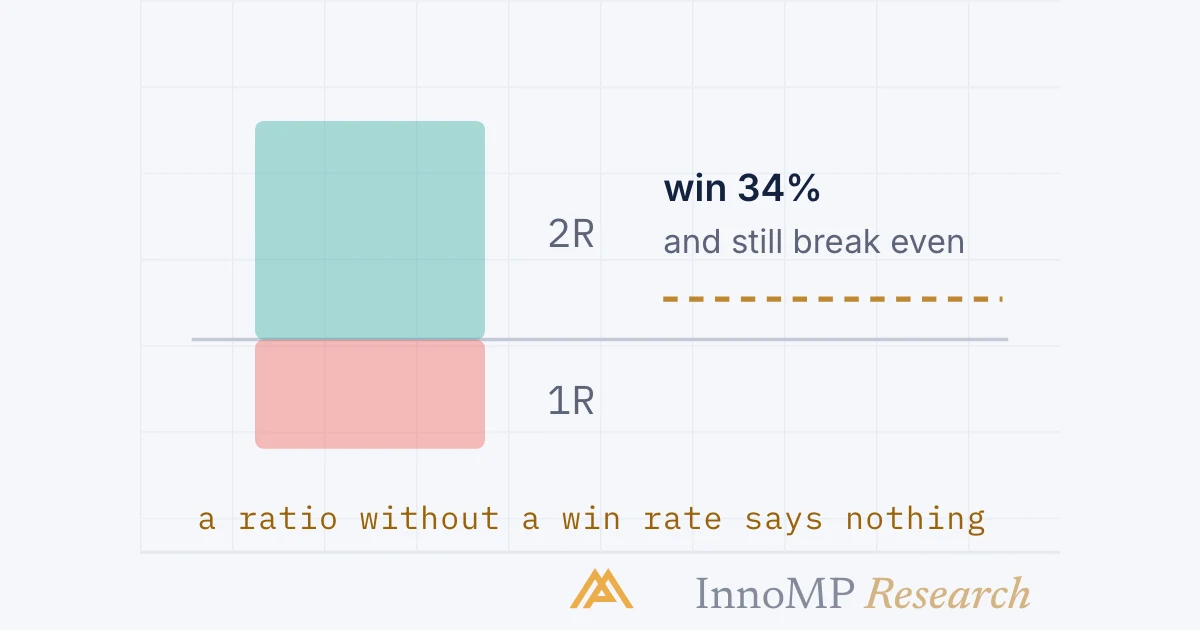
The ratio means nothing alone. It means everything next to the win rate:
| Ratio | Break-even win rate |
|---|---|
| 1:1 | 50% |
| 1:2 | 33% |
| 1:3 | 25% |
| 2:1 | 67% |
A strategy winning 40% of the time is losing money at 1:1 and doing very nicely at 1:2. Two traders can share the same entries and opposite outcomes purely on trade management — this table is why.
The corollary runs the other way too: high-ratio approaches lose more often than they win, by design. A 1:3 strategy at a healthy 35% win rate spends most of its life in small losses punctuated by occasional large wins. Knowing that in advance is the difference between an ordinary drawdown and a crisis of confidence.
Key takeaway Win rate and reward ratio are two ends of one see-saw. Chasing either while ignoring the other is how traders end up with a 90% win rate and a losing account — many small wins, erased by few large losses, is a 1:5 ratio running in reverse.
The two ways the ratio gets gamed
The imaginary target. The stop is real — placed where the idea fails, per stop placement. The target, though, is often placed where it makes the ratio look good: measuring 20 pips of risk and then declaring a 60-pip target because that makes it 1:3 is astrology with extra steps. A target is only honest when it sits at structure — a prior level, a measured objective — that price has actual reason to reach. If honest targets on a setup only ever offer 1:0.8, the answer is a different setup, not a further target.
The moved stop. A 1:3 plan whose stop widens under pressure becomes a 1:1 trade that still gets journaled as 1:3. The planned ratio and the realised ratio are different numbers, and only the realised one compounds.
Thinking in R
The upgrade that makes all of this operational: record every trade in R-multiples — results as multiples of the initial risk. A full stop-out is −1R; a win at triple the risk is +3R.
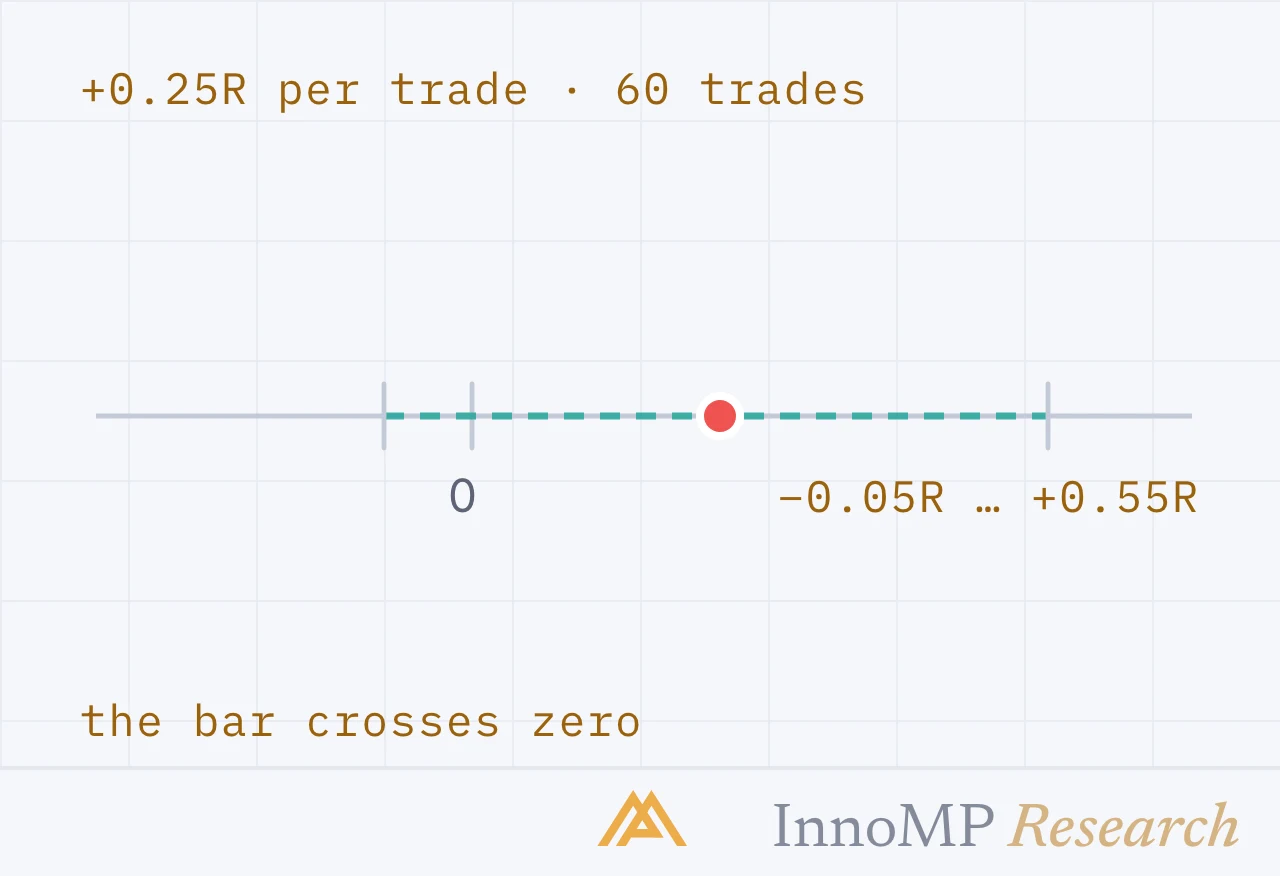
Journaling in R does three things at once. It normalises across instruments and sizes, so a gold trade and a EURUSD trade become comparable. It exposes management honestly — a journal full of +0.4R exits from 1:3 plans is a trader cutting winners, visible at a glance. And it makes expectancy computable: average R per trade × trades per month is the strategy’s actual engine, stated in one number.
Expectancy = (win rate × average win in R) − (loss rate × average loss in R)
A 40% win rate at +2R average against −1R losses: (0.4 × 2) − (0.6 × 1) = +0.2R per trade. Positive expectancy, sized honestly, repeated — that is the entire business, and the ratio is simply the part of it you choose before entry.
- Risk-reward ratio = (target − entry) ÷ (entry − stop).
- Break-even win rates: 50% at 1:1, 33% at 1:2, 25% at 1:3, 67% at 2:1.
- A strategy winning 40% of the time loses money at 1:1 and is profitable at 1:2.
- An R-multiple expresses a result as a multiple of the initial risk: a full stop-out is −1R, a win at three times the risk is +3R.
- Expectancy = (win rate × average win in R) − (loss rate × average loss in R).