Skip to content
Research / Education / Indicators

TA · Foundations · Part 17 of 20

RSI explained: why overbought does not mean sell

The Relative Strength Index measures the speed of recent gains against recent losses. What the 70 and 30 lines actually mark, and the one RSI signal worth more than either.

InnoMP Research Published 30 Aug 2026 · Updated 02 Sept 2026 7 min read
In short

The Relative Strength Index measures the magnitude of recent gains relative to recent losses on a 0–100 scale, typically over 14 periods. Readings above 70 are conventionally called overbought and below 30 oversold, but these mark strong momentum rather than turning points — in a strong trend RSI can stay above 70 for a long time. Divergence between RSI and price is generally the more useful signal.

The Relative Strength Index measures the magnitude of recent gains relative to recent losses, on a scale of 0 to 100. The default lookback is 14 periods.

Note what it does not measure: value, or how far price has travelled. RSI at 75 does not mean an instrument is expensive. It means the last fourteen periods have been dominated by up-closes.

That distinction is the source of nearly every RSI mistake.

What the numbers mean

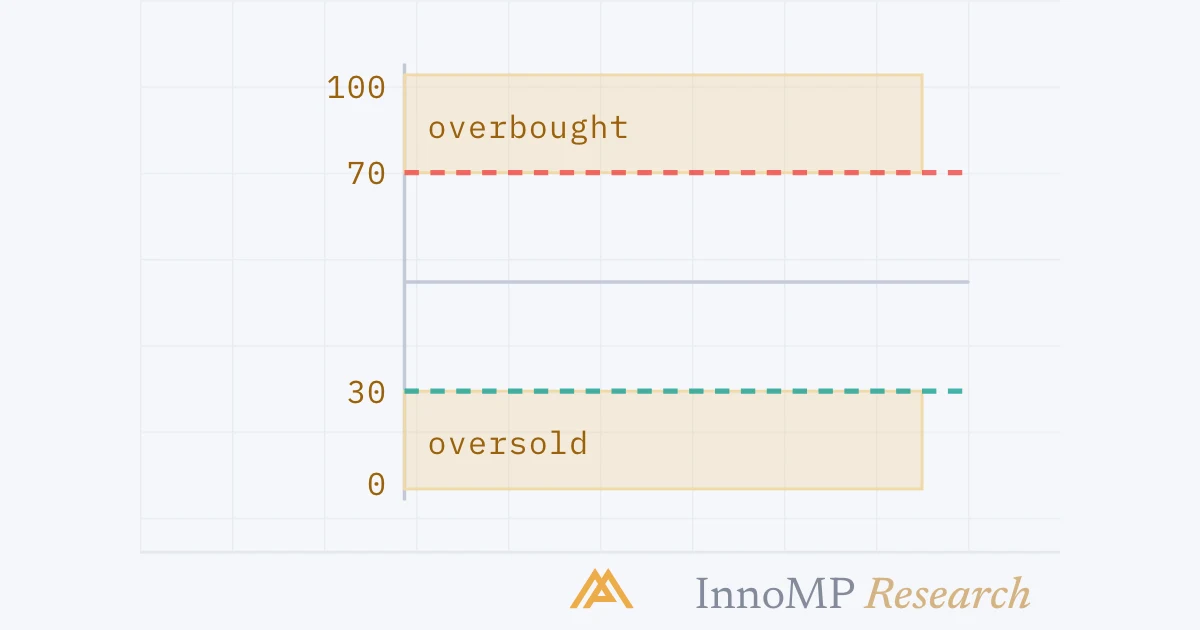
The RSI scale from 0 to 100 with its conventional zones A vertical scale from 0 at the bottom to 100 at the top. The region above 70 is shaded and labelled overbought, the region below 30 is shaded and labelled oversold, the midline at 50 is marked, and each zone carries a plain description of what it actually says. 1007050300”Overbought”gains dominated recentlyNeutralmidline: gains = losses”Oversold”losses dominated recently InnoMP Research
The labels sound like verdicts. What the readings actually describe is the balance of recent up-closes and down-closes — nothing about value.

“Overbought” is an unfortunate label. It sounds like a verdict — too high, due to fall — when the reading is a description of momentum. Strong momentum is what trends are made of.

The mistake the labels cause

RSI holding above 70 through a sustained uptrend A rising price line above an RSI panel in which the RSI line stays above the seventy level for the whole advance. Three sell markers are placed on the price line at points where a trader acting on overbought readings would have shorted, each followed by further gains. Pricesold here… and here… and hereRSI70never drops back below 70 InnoMP Research
Selling every overbought reading means systematically shorting the strongest markets available.

In a strong uptrend, RSI can hold above 70 for many periods while price continues climbing. The reverse holds in downtrends: RSI can stay beneath 30 through the whole decline. Buying oversold readings in a downtrend is catching a falling knife with a number for justification.

The same RSI extreme read in a range and in a trend Two panels. On the left price oscillates between two horizontal boundaries and the overbought reading coincides with the upper boundary, marked meaningful. On the right price trends strongly upward and the same overbought reading occurs mid-advance, marked confirmation of strength. In a rangeextreme = boundary→ meaningfulIn a trendextreme = strength→ not a sell InnoMP Research
Same indicator, opposite interpretation — and the thing that decides it is a classification RSI itself cannot make.

The reconciliation is Part 4 again. In a range, RSI extremes are meaningful — price is oscillating between boundaries and momentum extremes coincide with them. In a trend, RSI extremes confirm strength rather than warning of reversal.

Divergence

The RSI signal worth more than either threshold.

Bearish divergence between price and RSI A price panel where two peaks are connected by a rising line showing a higher high, above an RSI panel where the corresponding two peaks are connected by a falling line showing a lower high. Pricehigher highRSIlower high InnoMP Research
Price reached a new extreme; momentum did not. Buyers got there, but with less force behind them.

Bearish divergence: price makes a higher high; RSI makes a lower high. The new peak was reached with less momentum than the previous one.

Bullish divergence: price makes a lower low; RSI makes a higher low. Sellers reached a new low with less conviction.

Divergence describes something real: a move continuing while the energy behind it diminishes. It connects to the structural warning in Part 7, and the two often appear together — divergence first, then a lower high, then a break of structure.

Two cautions. Divergence can persist, sometimes for a long time, before anything happens. It is a warning about condition, not a timing signal. And it is only meaningful at structurally significant points — divergence between two random intraday peaks is noise.

Key takeaway Use RSI to describe momentum, and let price structure decide entries. Divergence at a tested resistance level, alongside a lower high, is three independent things agreeing. Divergence alone is one thing, and it is the weakest of the three.

Settings and practice

14 periods is standard and the most widely watched, which — as with moving averages — is part of why it works. Shorten it for more signals and more noise; lengthen it for fewer and steadier. Change it for a reason, not to improve the appearance of past signals.

RSI pullbacks holding above the 50 midline in an uptrend An RSI panel where the line dips repeatedly but each dip turns around at or just above the fifty level, then a final dip that pushes clearly below fifty and stays there, marked character changed. 705030below 50character changed InnoMP Research
Often a better trend filter than the 70 and 30 lines. While the dips hold above 50, the trend is doing what a trend does.

The 50 midline is underused. In an uptrend, RSI pullbacks that hold above 50 suggest the trend is intact; sustained moves below 50 suggest the character has changed. This is often a better trend filter than the 70/30 lines.

InnoMP’s Market Watcher supports RSI alerts for overbought, oversold and custom thresholds, combinable with price conditions. “Price at my level AND RSI below 40” is a far more selective alert than either alone — and selectivity is the whole point.

Next: MACD explained — the relationship between two moving averages, turned into a signal.

Key facts
  • RSI is bounded between 0 and 100 and is usually calculated over 14 periods.
  • Above 70 is conventionally overbought; below 30 oversold.
  • In a strong trend, RSI can remain overbought or oversold for extended periods without reversing.
  • Divergence occurs when price makes a new extreme and RSI does not.
Frequently asked questions

What does RSI measure?

The ratio of average gains to average losses over a lookback period, expressed on a 0–100 scale. High readings mean recent periods have been dominated by gains; low readings mean losses have dominated. It measures the character of recent movement, not value.

Does RSI above 70 mean I should sell?

No. It means momentum is strong to the upside. In a powerful trend RSI can hold above 70 for many periods while price keeps rising, so selling purely on an overbought reading means fading the strongest part of a move.

What is RSI divergence?

When price makes a higher high but RSI makes a lower high — or price makes a lower low and RSI makes a higher low. It indicates the new extreme was reached with less momentum than the previous one, suggesting the move is weakening.

What RSI period should I use?

14 is the standard and the most widely watched. Shorter periods react faster and produce more signals with more noise; longer periods are smoother and slower. Change it only for a specific reason, not to make past signals look better.

InnoMP Research

Market research, trading education and platform guides from the InnoMP research desk — covering forex, metals, indices and stock CFDs.

Published 30 Aug 2026 · Updated 02 Sept 2026 · Reviewed by InnoMP Compliance

Disclaimer: This content is provided for general informational purposes only and does not constitute investment advice, an offer, or a solicitation to buy or sell any financial instrument. It has been prepared without regard to your individual financial circumstances or objectives. Trading CFDs involves a high risk of loss.

Related notes