Skip to content
Research / Education / Indicators

TA · Foundations · Part 18 of 20

MACD explained: momentum from two moving averages

The MACD line, the signal line and the histogram — what each one is, what a crossover really tells you, and why the histogram often speaks first.

InnoMP Research Published 30 Aug 2026 · Updated 02 Sept 2026 6 min read
In short

MACD (Moving Average Convergence Divergence) plots the difference between two exponential moving averages, usually the 12 and 26 period. A signal line — a 9-period average of that difference — is drawn over it, and a histogram shows the gap between the two. Crossovers indicate momentum shifts, the zero line marks where the two underlying averages cross, and divergence works as it does with RSI.

MACD plots the difference between two exponential moving averages. With the standard settings, it is the 12-period EMA minus the 26-period EMA. A signal line — a 9-period EMA of that difference — is drawn over it, and a histogram plots the gap between the two.

Everything MACD says is derived from Part 16. If you understood moving averages, you already understand this.

Where the MACD line comes from

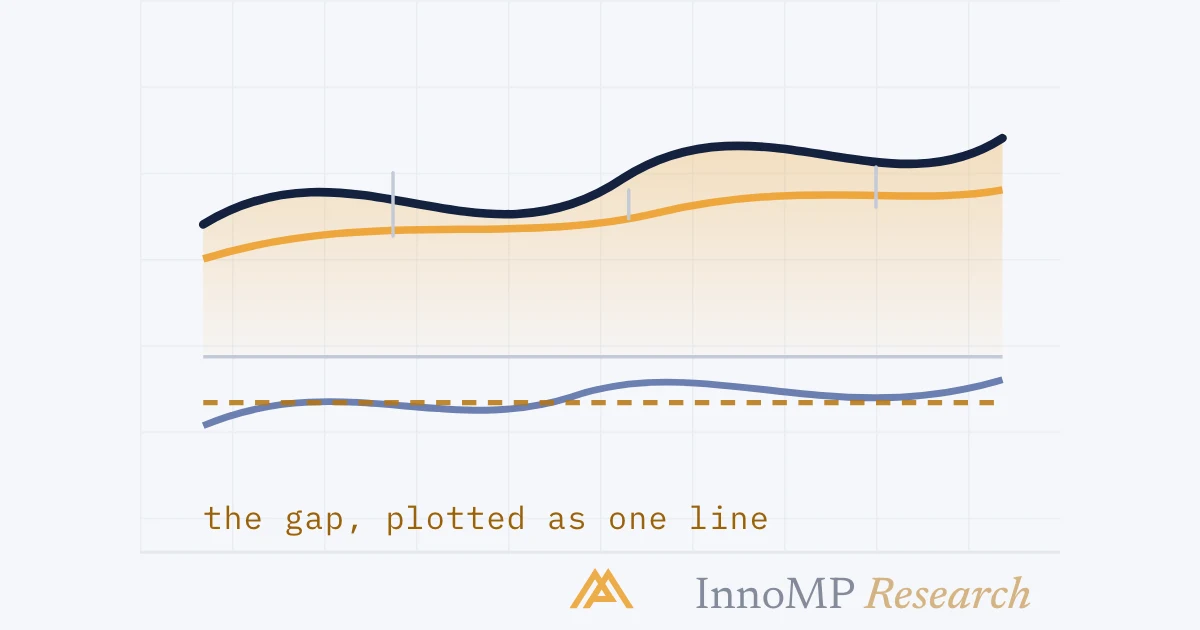
The gap between two moving averages becoming the MACD line A price chart with a fast and a slow moving average. Vertical arrows mark the gap between them at three points, widening then narrowing. Below, a line panel plots those same gaps as a single curve crossing a zero line. two moving averagesthe gap, plotted0widest here InnoMP Research
The whole indicator is one measurement: how far apart the two averages are. Above zero means the fast one is ahead.

The MACD line measures separation between the two averages. Rising means they are pulling apart — the fast average is accelerating away, so momentum is building. Falling means they are converging, so momentum is fading.

The signal line is a smoothed version of the MACD line. Its only job is to provide a reference for crossovers.

The histogram

The histogram as the distance between the MACD line and the signal line A panel with two lines and vertical bars between them. The bars grow taller as the lines separate, shrink as they converge, and reach zero height exactly where the two lines cross. 0bars peak……lines cross later InnoMP Research
The bars peak and start shrinking before the lines actually cross — the earlier read, at the cost of more false alarms.

The histogram is MACD minus signal. It crosses zero at exactly the moment the two lines cross, but its height is visible before that — which is why it often communicates a shift sooner than the crossover does.

The four signals

Signal line crossover and zero line cross compared Two panels of the MACD indicator. The left highlights the point where the MACD line crosses its signal line, labelled faster and more frequent. The right highlights the point where the MACD line crosses the zero line, labelled slower and more significant. Signal crossfrequent, earlyand lagging price0Zero crossrare, slowerthe EMAs themselves crossed InnoMP Research
The signal crossover happens often and early; the zero cross happens rarely and means the two moving averages themselves have crossed.

Signal line crossover. MACD crossing above its signal line suggests momentum turning up. The most-used MACD signal and the most lagging, since both lines are averages of averages.

Zero line cross. MACD crossing zero means the 12 EMA has crossed the 26 EMA — a slower, more significant event, and closer to a genuine change in trend character.

Histogram turn. The histogram peaking and beginning to shrink means momentum is fading before the lines actually cross. Earlier, and correspondingly noisier.

Divergence. Price makes a higher high while MACD makes a lower high. Identical logic to RSI divergence: a new extreme reached with less force behind it.

The limitation, stated plainly

MACD is built from moving averages, so it inherits their weakness completely: it fails in ranges.

MACD crossovers accumulating through a sideways market A sideways price chart above a MACD panel where the two lines hug the zero line and cross each other five times in a short span, each crossing marked with a small loss tag. Price · sideways0six crosses, six small losses InnoMP Research
Crossover after crossover, none of which lead anywhere. The tool is out of season, not defective.

In a sideways market the two EMAs sit close together and cross repeatedly. A trader following MACD crossovers through a consolidation accumulates a stream of small losses — which is exactly the drawdown-versus-broken-strategy distinction: the tool is out of season, not defective.

Key takeaway MACD is a momentum description, not a trade trigger. Its useful role is confirming that a setup you found in price structure has momentum behind it. A MACD crossover with no level and no structure is a line crossing another line.

Practical use

Confirm, do not initiate. Find the setup in structure — a level, a pullback, a break. Then check whether MACD agrees. If the histogram is shrinking while you plan a long, that disagreement is worth respecting.

Prefer the zero line for trend filtering. MACD above zero as a condition for taking longs is a cleaner filter than trading every signal crossover.

A histogram shrinking while a long position is still open A rising price line with an open long position marked, above a histogram whose bars peak and then shrink for several periods while price is still rising, with the shrinking section highlighted. Price · still risinglongshrinkingtighten the stop, do not add InnoMP Research
Momentum draining while the position is still profitable — usually a better reason to tighten a stop than to exit outright.

Watch the histogram for early warning on open positions. A histogram that peaks and shrinks while you are long is momentum draining — often a better reason to tighten a stop than to exit outright.

The standard 12-26-9 settings are near-universal. As with RSI’s 14, their popularity is part of their efficacy. InnoMP’s Market Watcher supports MACD alerts on zero-axis crosses and golden/death crosses, combinable with price conditions.

Next: Bollinger Bands and ATR — measuring volatility rather than direction.

Key facts
  • The MACD line is the 12-period EMA minus the 26-period EMA.
  • The signal line is a 9-period EMA of the MACD line.
  • The histogram plots MACD minus signal, so it crosses zero exactly when they cross.
  • MACD crossing its zero line means the two underlying moving averages have crossed.
Frequently asked questions

What does MACD stand for?

Moving Average Convergence Divergence. It measures whether two moving averages are moving toward each other or apart, which is a way of measuring whether momentum is building or fading.

What is a MACD crossover?

When the MACD line crosses its signal line. A cross above suggests momentum is turning up; a cross below suggests the opposite. Because both lines derive from moving averages, crossovers lag the price move that caused them.

What does the MACD histogram show?

The distance between the MACD line and the signal line. It shrinks as the two converge and often peaks before a crossover occurs, which is why some traders watch it for an earlier read than the crossover itself.

What does the MACD zero line mean?

The point where the two underlying moving averages are equal. MACD above zero means the faster average is above the slower one — a broadly bullish configuration — and below zero the reverse.

InnoMP Research

Market research, trading education and platform guides from the InnoMP research desk — covering forex, metals, indices and stock CFDs.

Published 30 Aug 2026 · Updated 02 Sept 2026 · Reviewed by InnoMP Compliance

Disclaimer: This content is provided for general informational purposes only and does not constitute investment advice, an offer, or a solicitation to buy or sell any financial instrument. It has been prepared without regard to your individual financial circumstances or objectives. Trading CFDs involves a high risk of loss.

Related notes

Indicators

RSI explained: why overbought does not mean sell

The Relative Strength Index measures the speed of recent gains against recent losses. What the 70 and 30 lines actually mark, and the one RSI signal worth more than either.

7 min read