Bollinger Bands plot a moving average with an upper and lower band set a number of standard deviations away, so the bands widen when volatility rises and narrow when it falls. Average True Range (ATR) measures the average size of recent price ranges in price terms. Neither indicates direction; both are used to size stops and positions to current conditions.
Bollinger Bands and ATR both answer “how much does this instrument move?” rather than “which way?” That makes them different in kind from everything else in this series — and arguably more directly useful, because the answer feeds straight into stop distance and therefore into position size.
Bollinger Bands
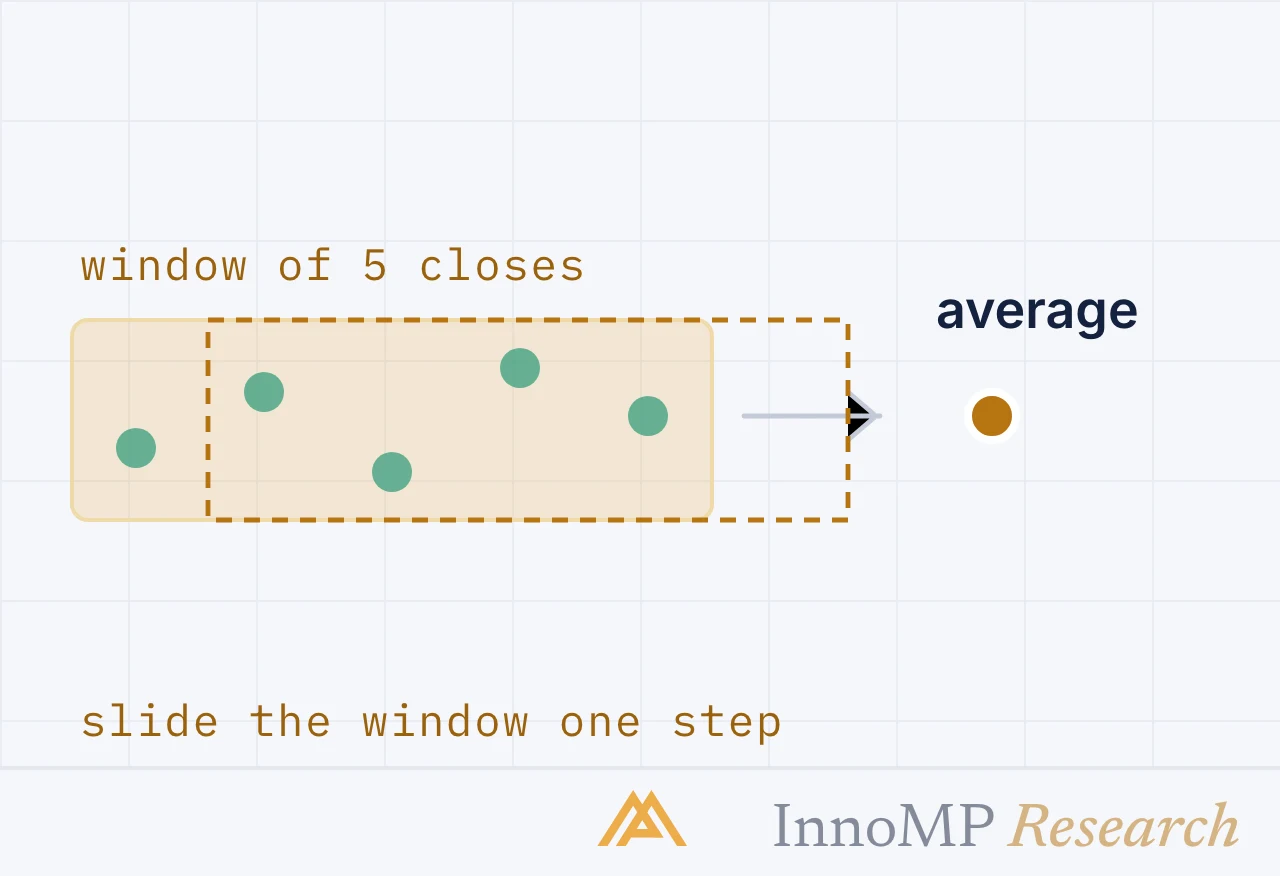
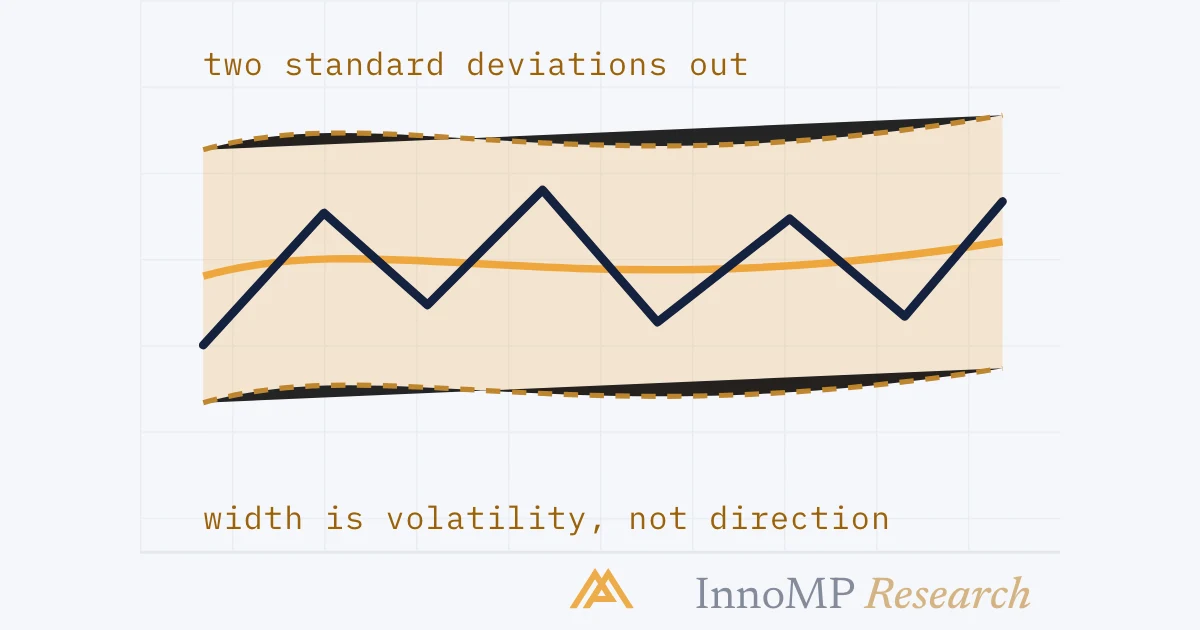
Three lines. A middle band — usually a 20-period simple moving average. An upper and lower band, set a number of standard deviations away, usually two.
Because standard deviation is a measure of dispersion, the bands widen when recent movement has been variable and narrow when it has been calm.
The squeeze
A sharp narrowing indicates unusually quiet conditions. Since compressed ranges resolve into expansion — the mechanism from Part 12 — a squeeze signals that a larger move is likely to arrive. It says nothing about direction.
Band touches are not signals
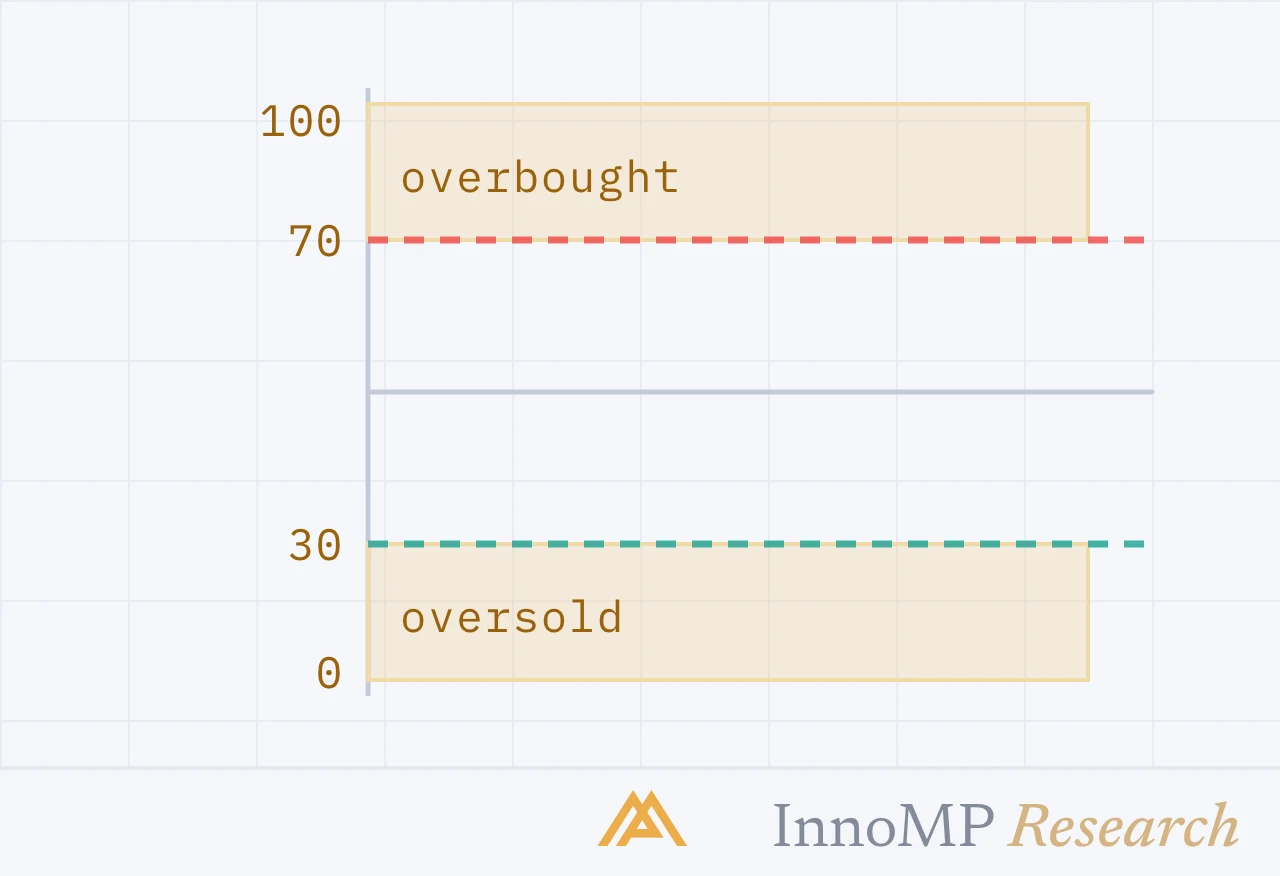
Price at the upper band is at the edge of its recent statistical range. In a range that may mark a turning point; in a trend, price can ride the upper band for many periods while climbing steadily. Selling every upper-band touch in a trend is the RSI overbought mistake wearing different clothes.
ATR
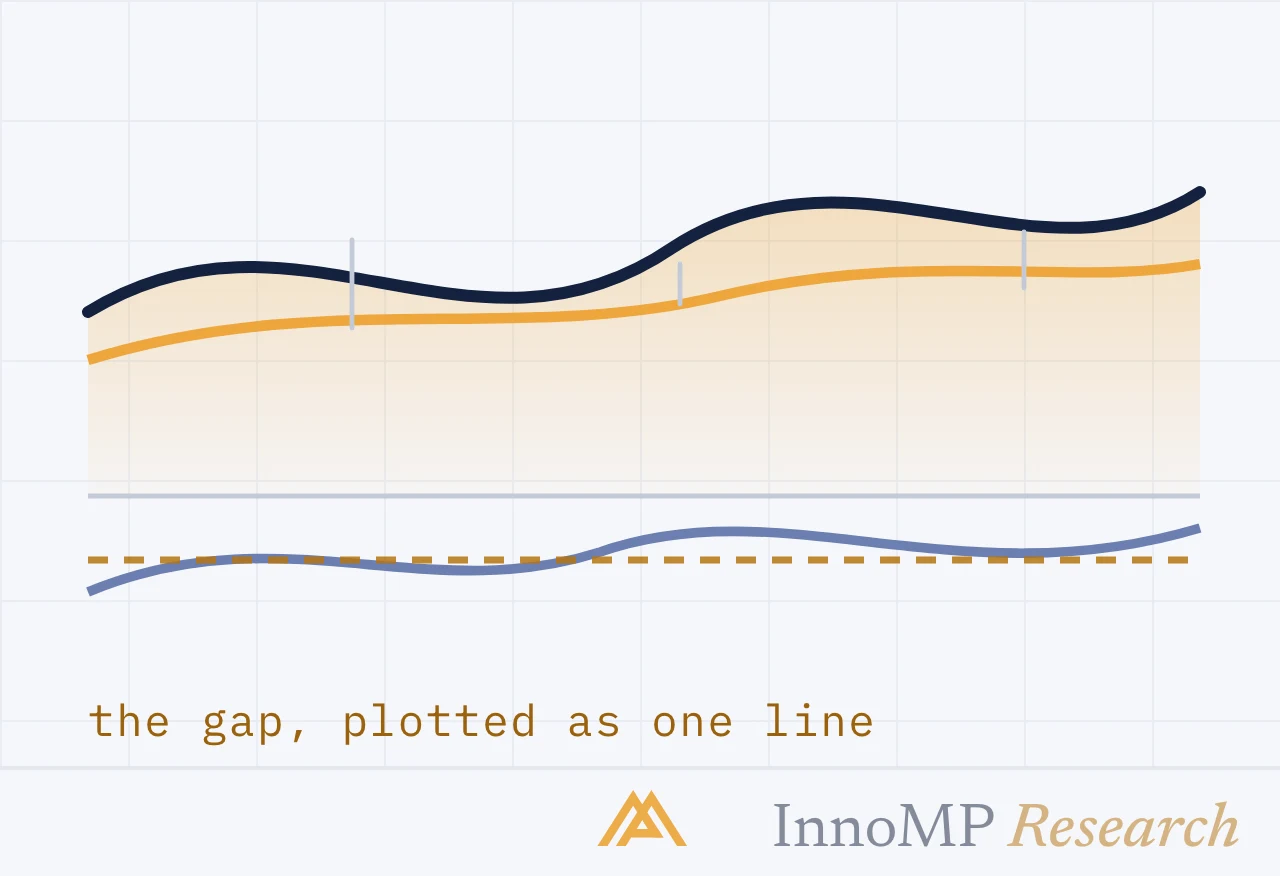
Average True Range measures the average size of recent price ranges, accounting for gaps. Unlike Bollinger Bands, it is expressed in price terms — pips, dollars, index points — which makes it directly usable in arithmetic.
That property is what makes ATR the most practically valuable indicator in this series.
Using ATR for stops and size
Stop-loss placement argued against fixed pip stops, because a 20-pip stop means something different on a quiet EUR/USD session than on a volatile gold session. ATR is the fix.
A stop set at a multiple of ATR — commonly 1.5× to 2× — adapts automatically. When the instrument is calm, the stop tightens. When it becomes volatile, the stop widens, and position size falls accordingly to hold risk constant.
A worked example on gold. ATR on the 4-hour chart reads 12.00.
- Stop distance at 2× ATR: 24.00
- Account 10,000 USD, risking 1%: 100 USD
- Gold pip value at 100 oz per lot: 100 USD per dollar of movement
- Position: 100 ÷ (24 × 100) = 0.04 lots
If ATR later rises to 20.00, the stop widens to 40.00 and the position falls to 0.025 lots — automatically, with no judgement required. The risk stayed at 1% while the market changed.
Key takeaway Volatility tools do not tell you what to trade. They tell you how much to trade, which is the decision that determines whether a strategy survives. Of everything in this series, this is the part that most directly affects your account balance.
Bollinger practice
Trade the squeeze, not the touch. A squeeze identifies when a move is likely, letting you prepare both directions. Band touches in a trend are the trend working normally.
Use the middle band as a trend reference. It is a 20-period moving average, so Part 16 applies: price consistently above it in an uptrend, and pullbacks toward it as entry zones.
Read width as a regime indicator. Persistently wide bands mean a volatile regime, in which the same lot size carries more risk — a reason to reduce size regardless of setup quality.
InnoMP’s Market Watcher supports Bollinger alerts on breaks above or below the upper, middle and lower bands, combinable with other conditions.
Next: Stochastics and KDJ — the last oscillator family, and how to stop adding indicators.
- Bollinger Bands are a moving average plus and minus a multiple of standard deviation, commonly 20 periods and 2 deviations.
- Band width contracts before volatility expands — the pattern known as a squeeze.
- ATR expresses average recent range in price terms, making it directly usable for stop distance.
- Price touching a band is not a signal; in a trend price can ride a band for many periods.