Indicators
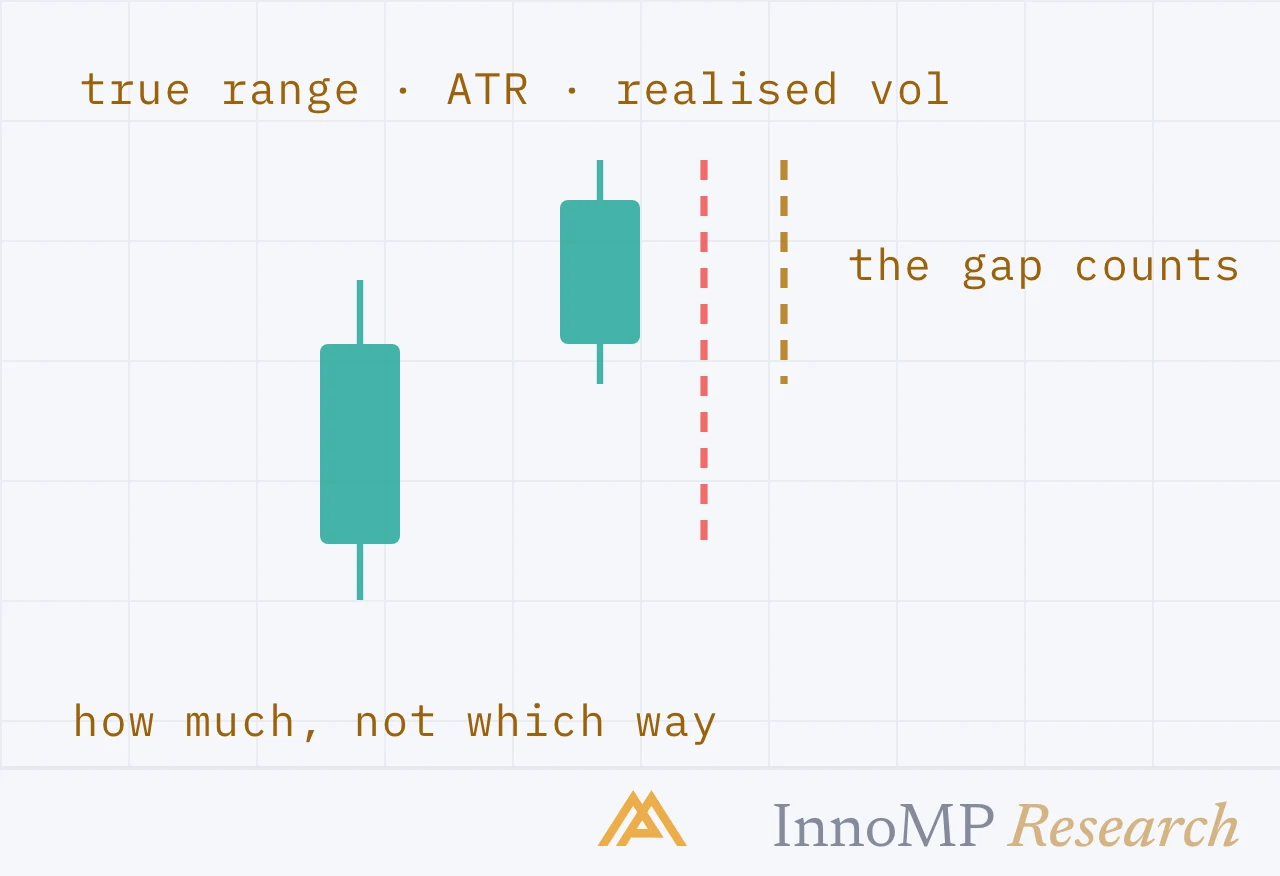
Volatility is how much price moves, not where. Three ways to measure it — the true range of a bar, its average over a window, and the standard deviation of returns — and what each one is for.
Read more → 8 min read
Indicators
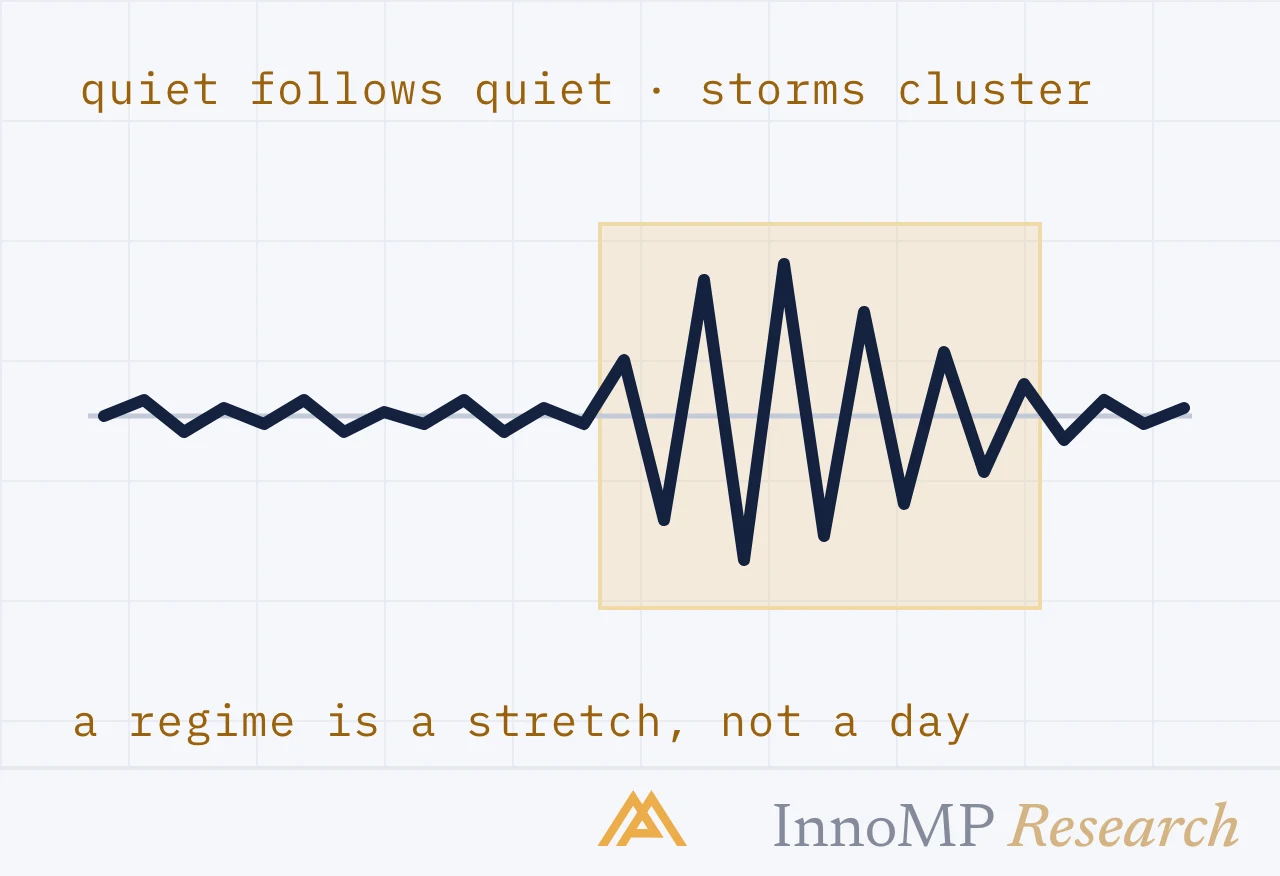
Volatility is not random day to day: large moves tend to follow large moves and small ones small. What a regime is, how to tell which one you are in, and why it changes every rule.
Read more → 8 min read
Indicators
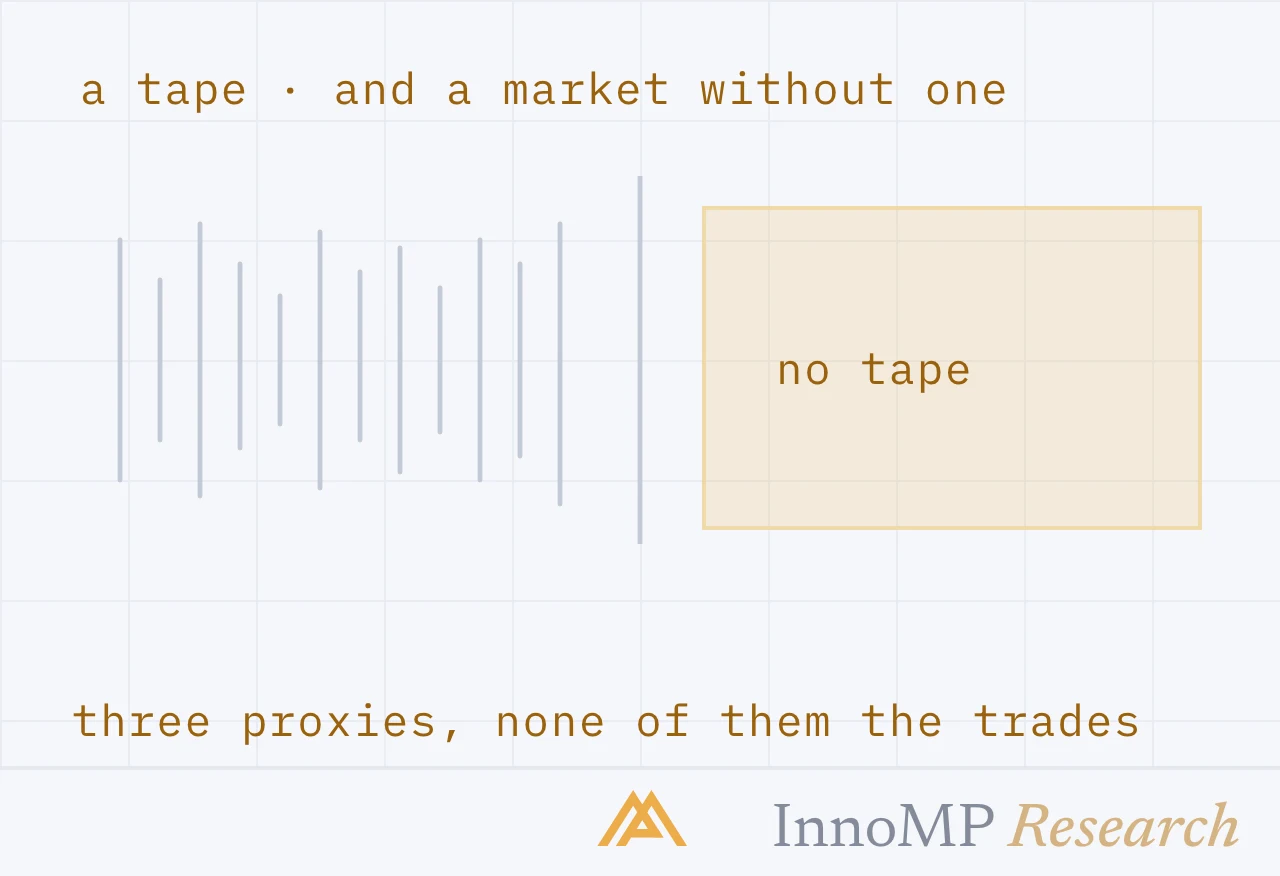
Order flow tools assume a tape: every trade, its size and side, in one place. Forex has no tape. What can stand in for it — tick volume, the broker's book, futures positioning — and where each one stops.
Read more → 8 min read
Indicators
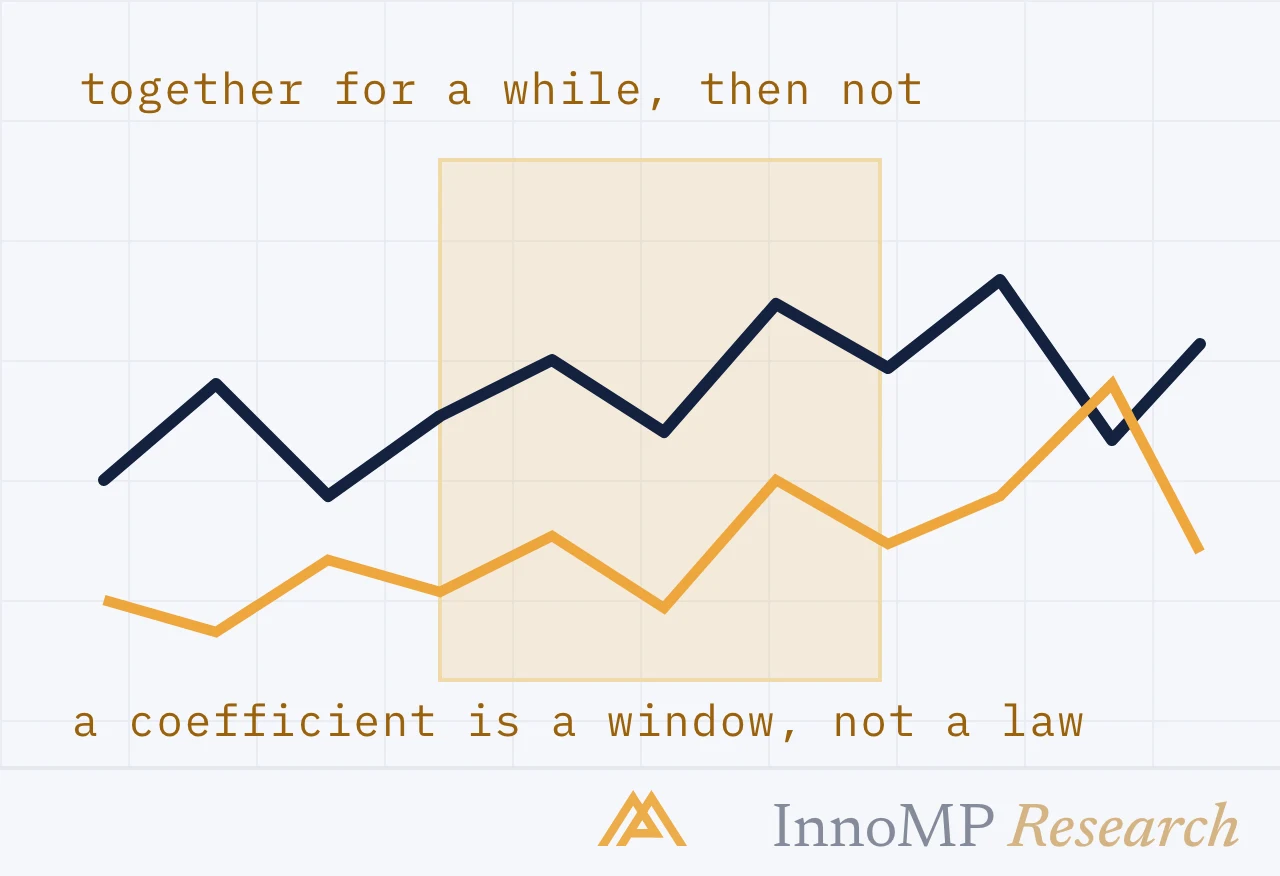
Some markets move together, some move opposite, and most of those relationships are temporary. What the correlation coefficient measures, why the number changes, and how to use it without mistaking a pattern for a law.
Read more → 8 min read
Trend
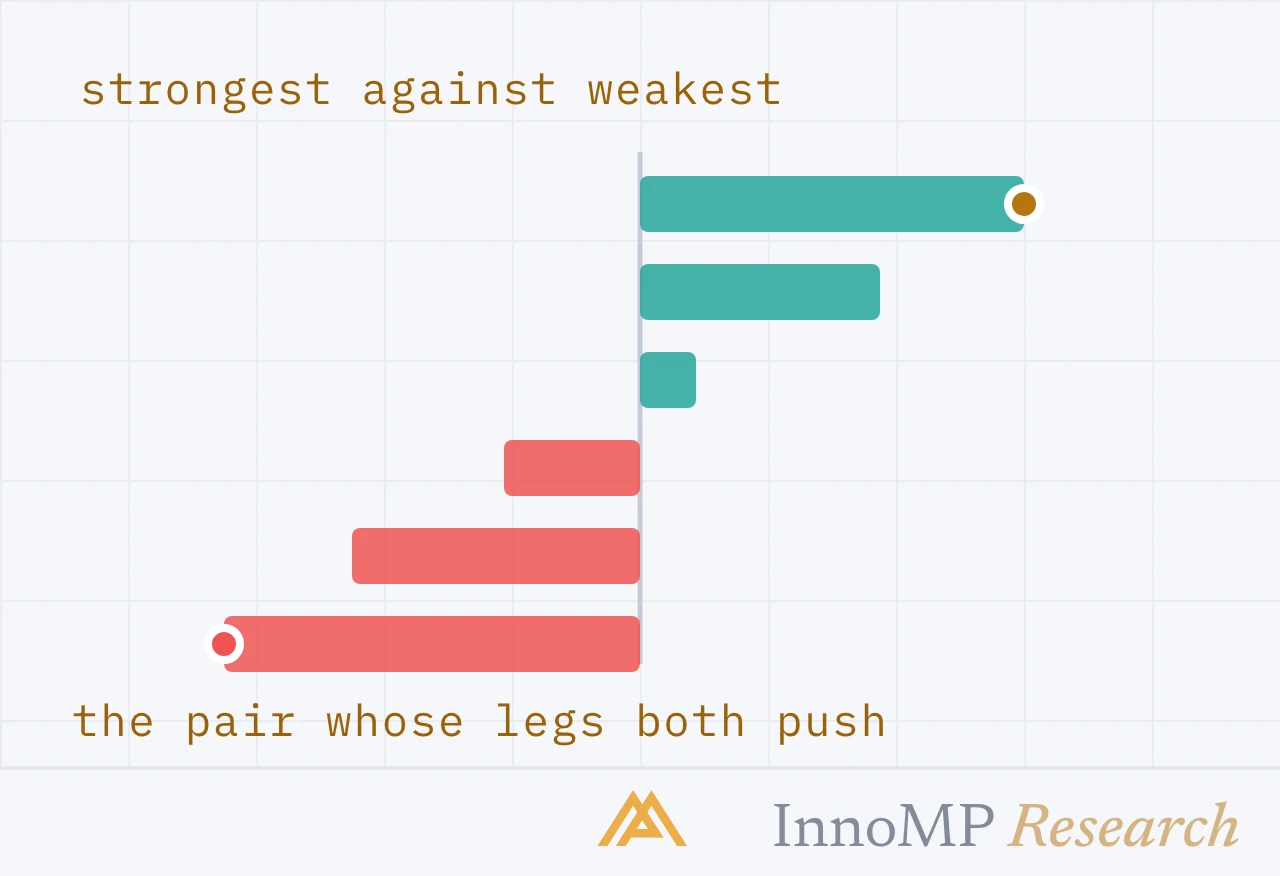
A pair is two currencies. When the euro is the strongest major and the dollar the weakest, EURUSD moves further than either leg alone. How to rank currencies, and why strongest against weakest trends cleanest.
Read more → 8 min read
Market hours
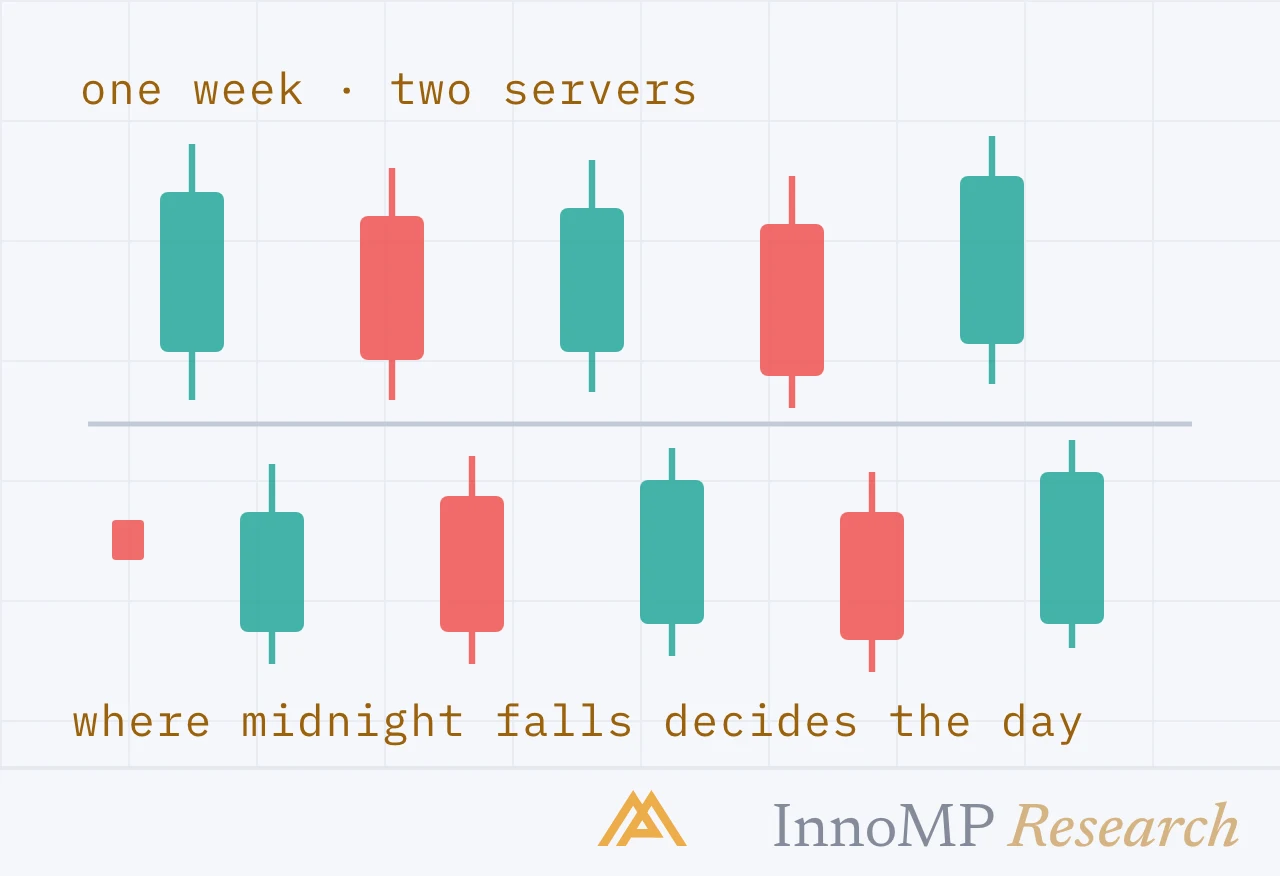
Two traders open the same pair on the same day and see different daily candles. Neither chart is wrong. Where a broker's server puts midnight decides what a day is — and every level built on daily candles moves with it.
Read more → 8 min read
Market structure
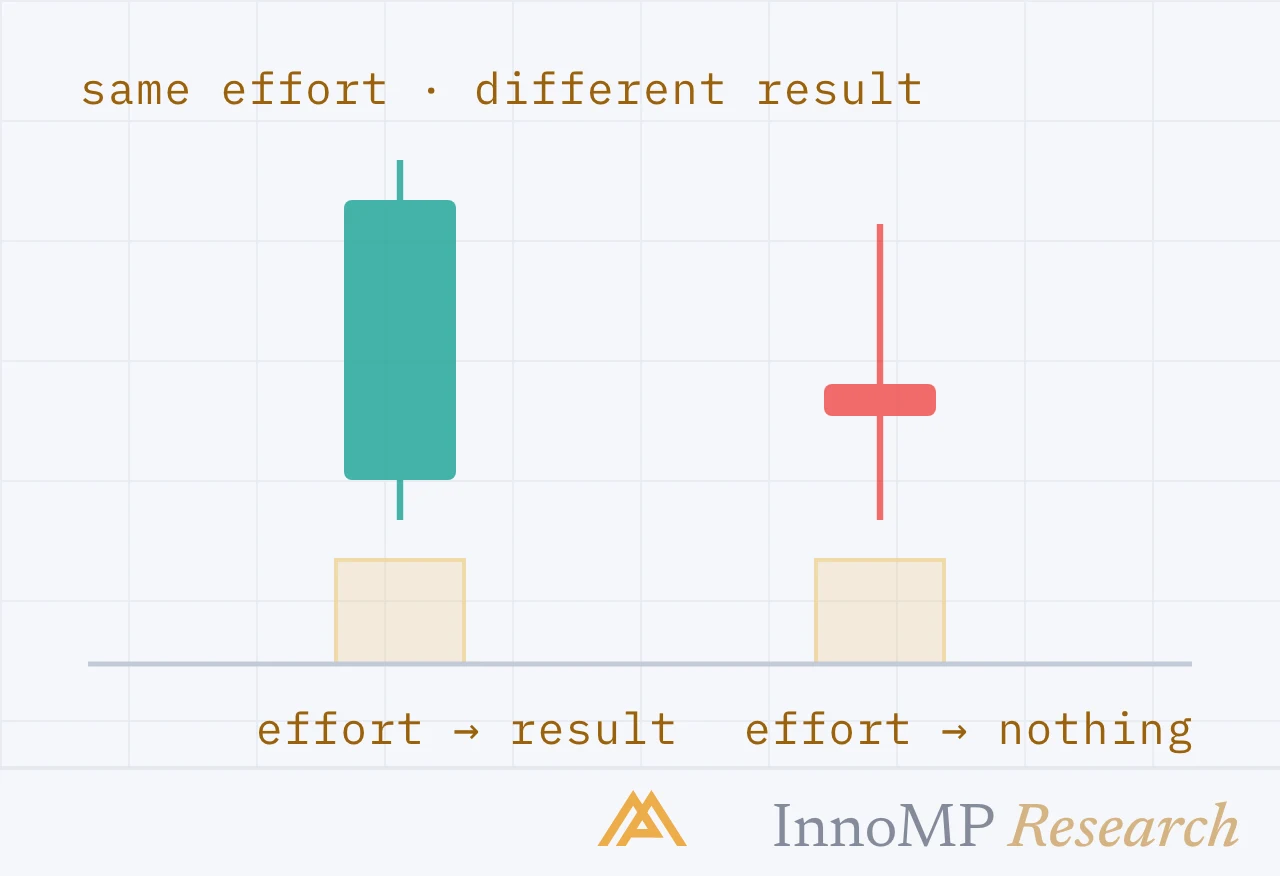
Volume is the effort; the price change it produced is the result. When they disagree — a busy candle that goes nowhere, a quiet one that goes far — the chart says something price alone cannot. The four combinations.
Read more → 8 min read
Market structure
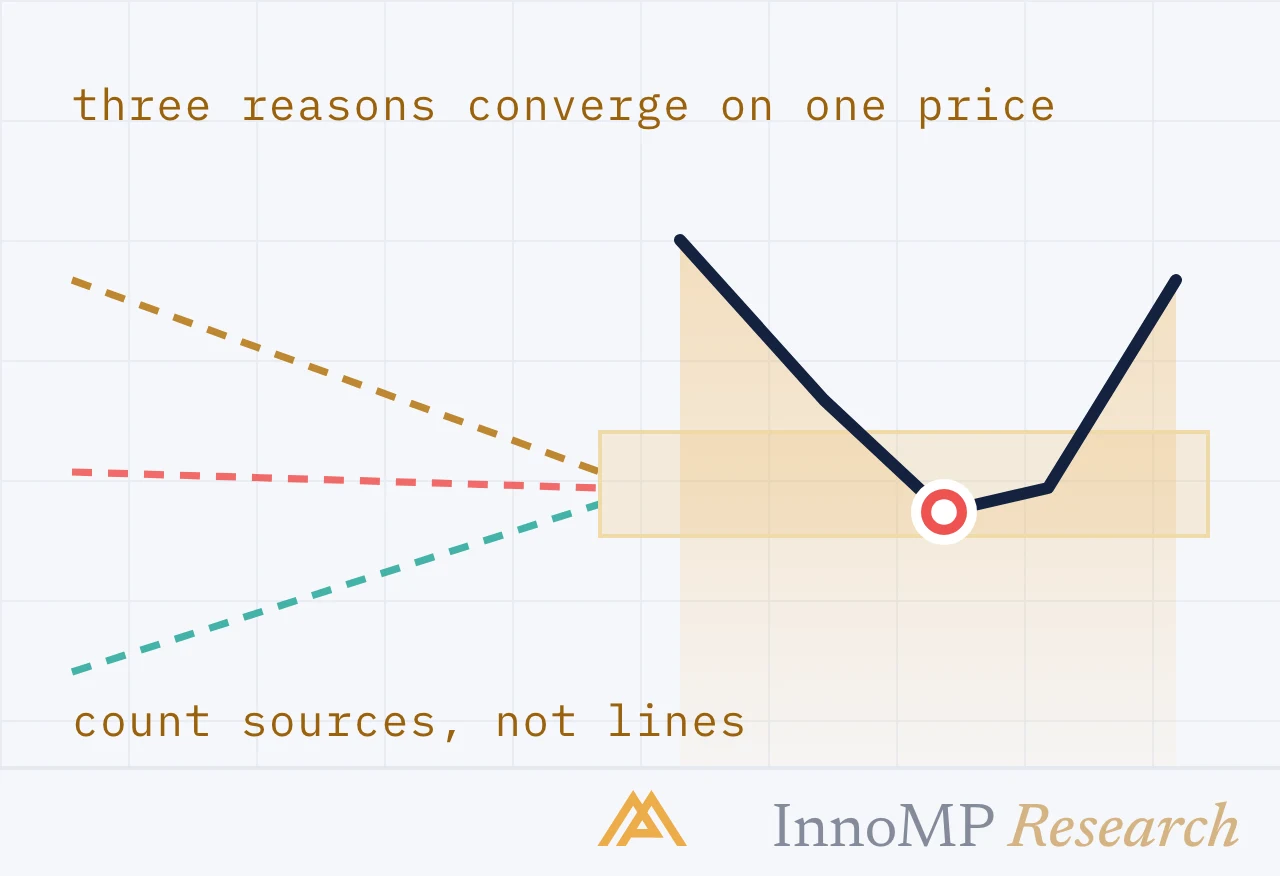
When the daily, the 4-hour and the 1-hour point the same way a trade has more behind it — if the reasons are independent. How to count confluence honestly, and why two indicators on one chart are one reason.
Read more → 8 min read
Indicators
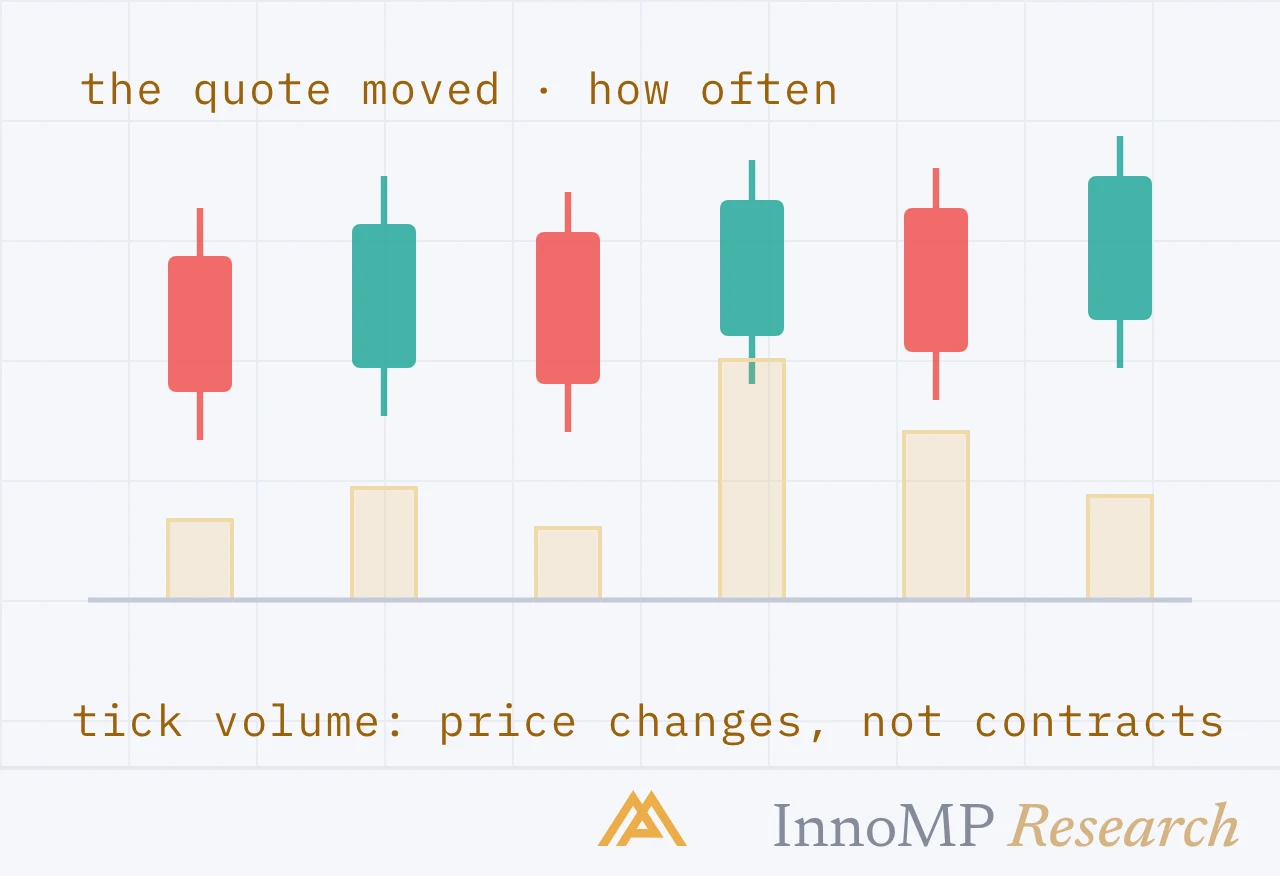
Forex has no central exchange, so the volume under a currency chart counts price changes, not contracts. What tick volume can still tell you, how to read it against the session, and where it misleads.
Read more → 8 min read
Market structure
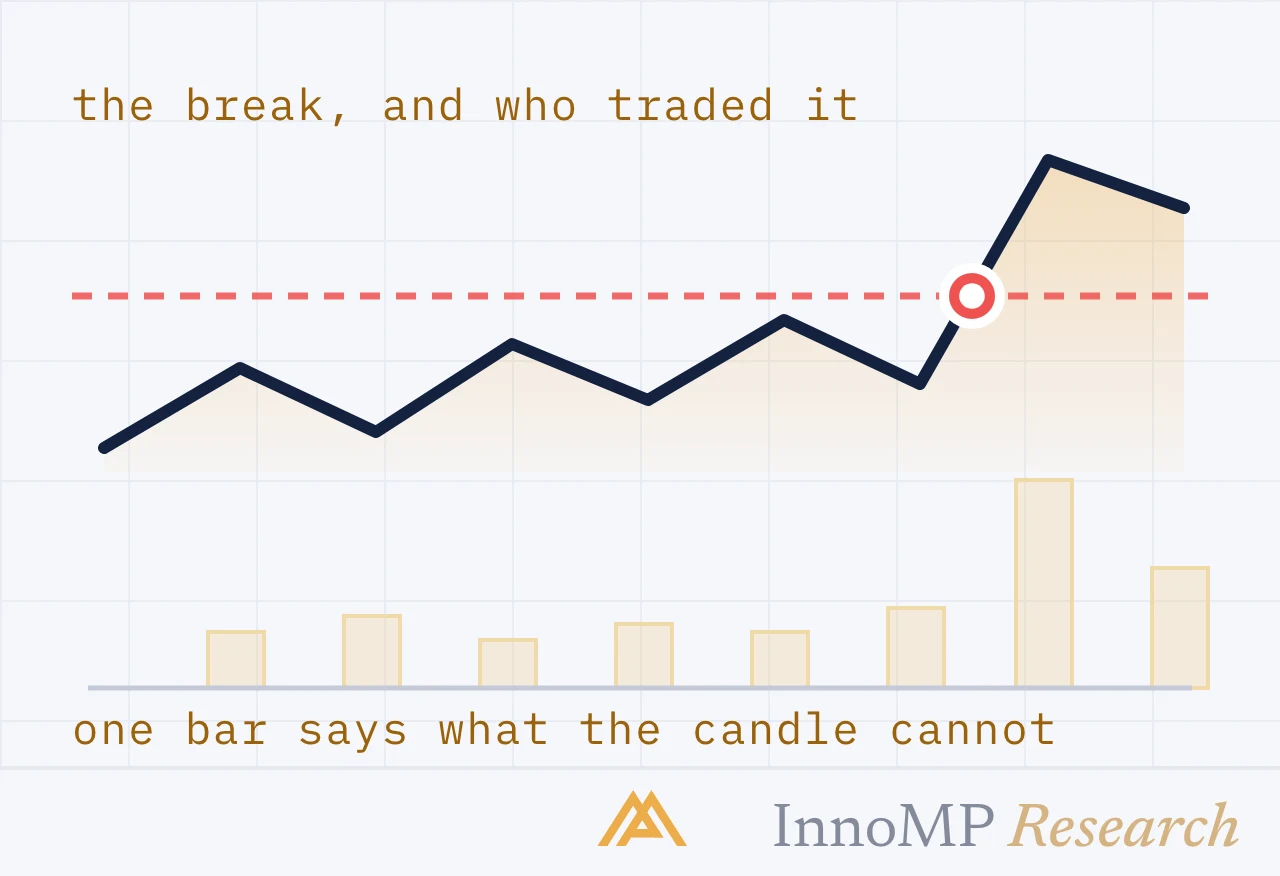
The two moments participation matters most: when price leaves a range, and when a move runs out. How to read tick volume at the break, at the retest and at the end of a trend — against the right baseline.
Read more → 8 min read
Indicators
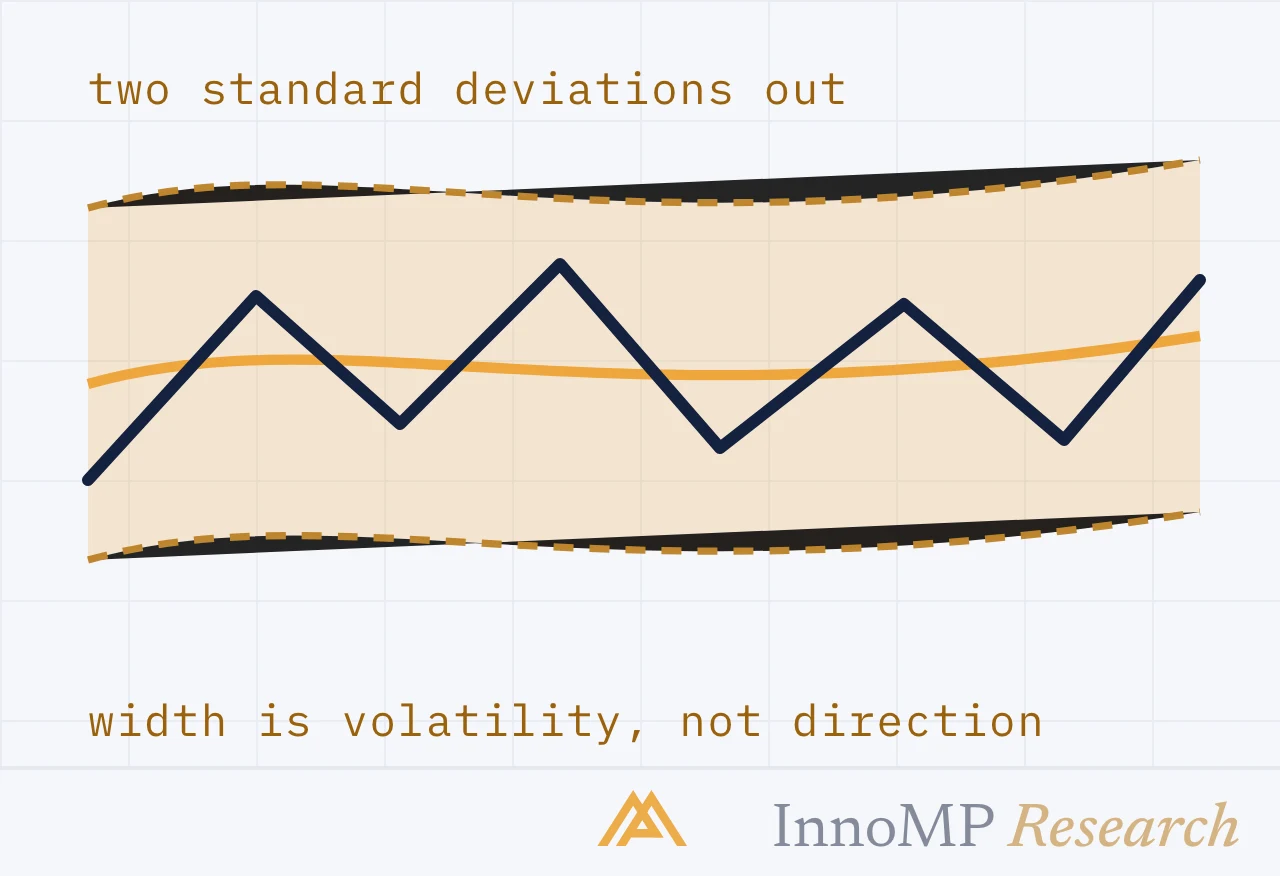
Two tools that answer 'how much does this move?' rather than 'which way?'. Why that question decides your stop distance — and therefore your position size.
Read more → 5 min read
Indicators
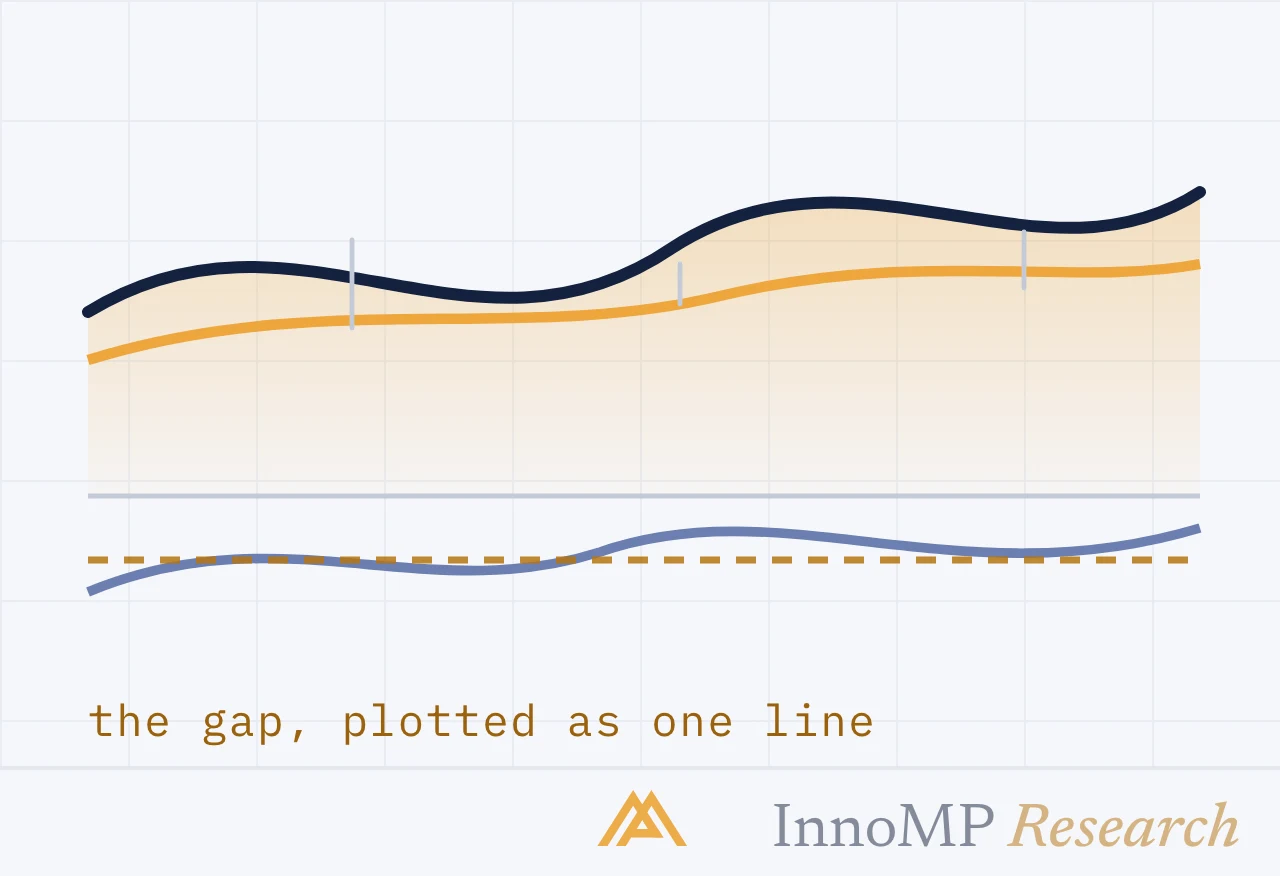
The MACD line, the signal line and the histogram — what each one is, what a crossover really tells you, and why the histogram often speaks first.
Read more → 5 min read
Indicators
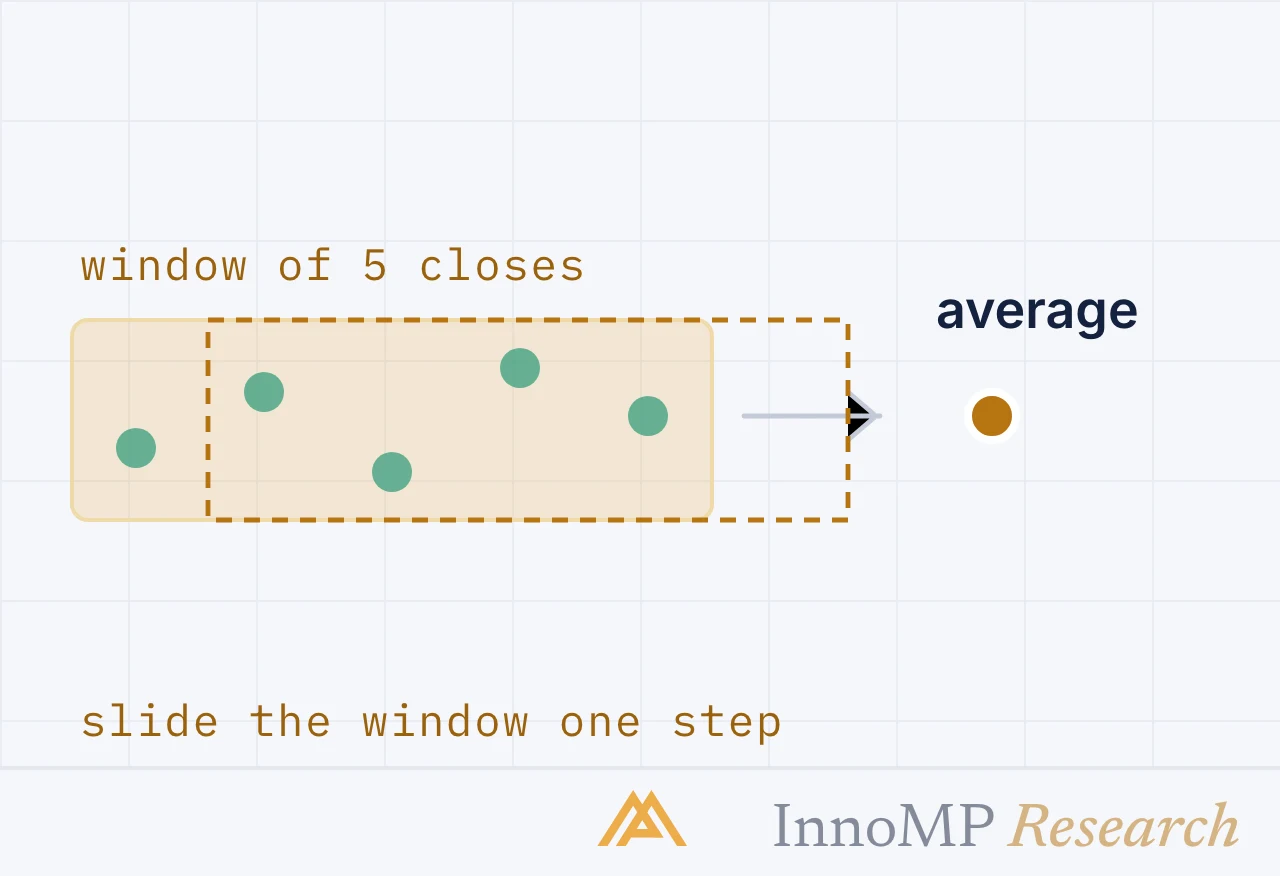
A smoothed line of past prices, and the four honest uses it has. Why crossovers lag, and what a moving average genuinely tells you that price alone does not.
Read more → 5 min read
Indicators
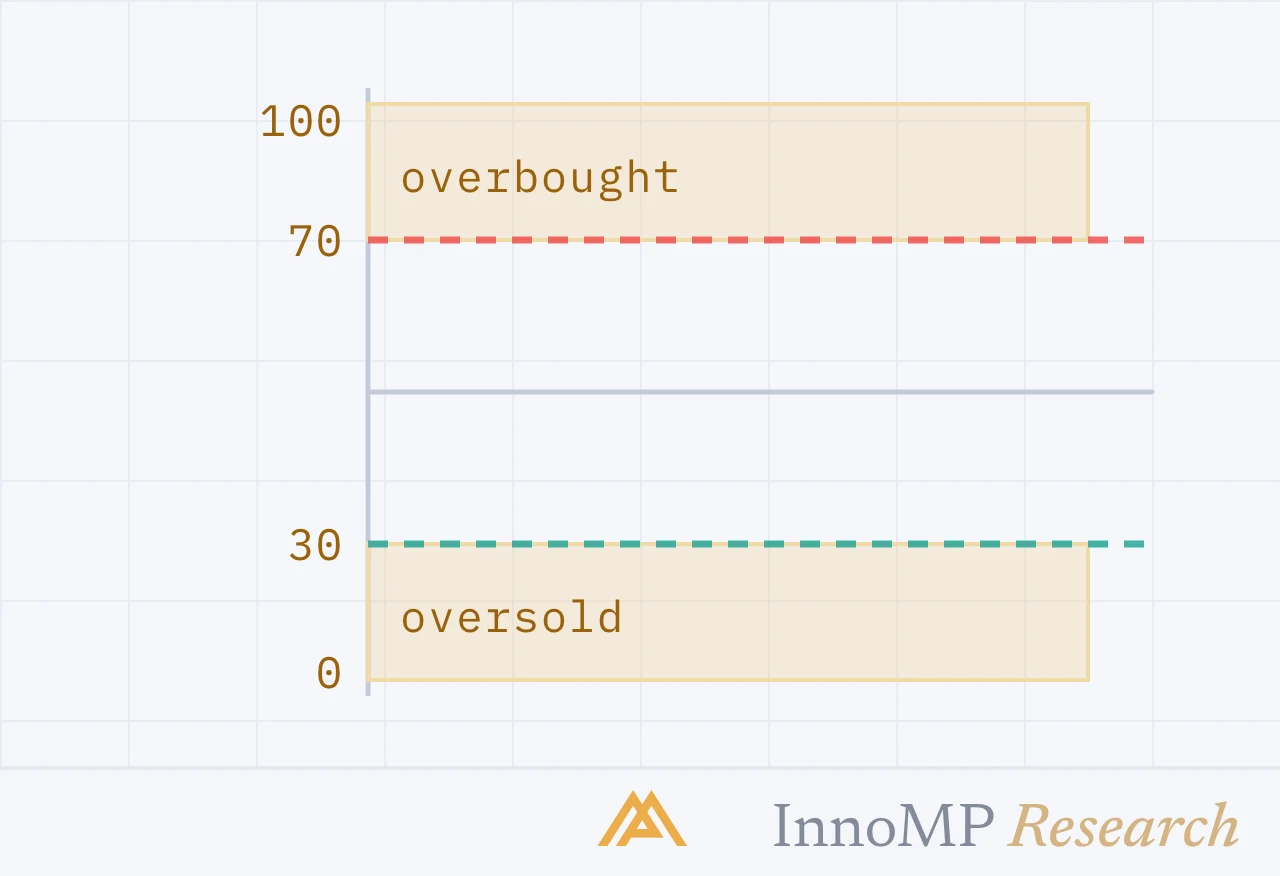
The Relative Strength Index measures the speed of recent gains against recent losses. What the 70 and 30 lines actually mark, and the one RSI signal worth more than either.
Read more → 5 min read
Indicators
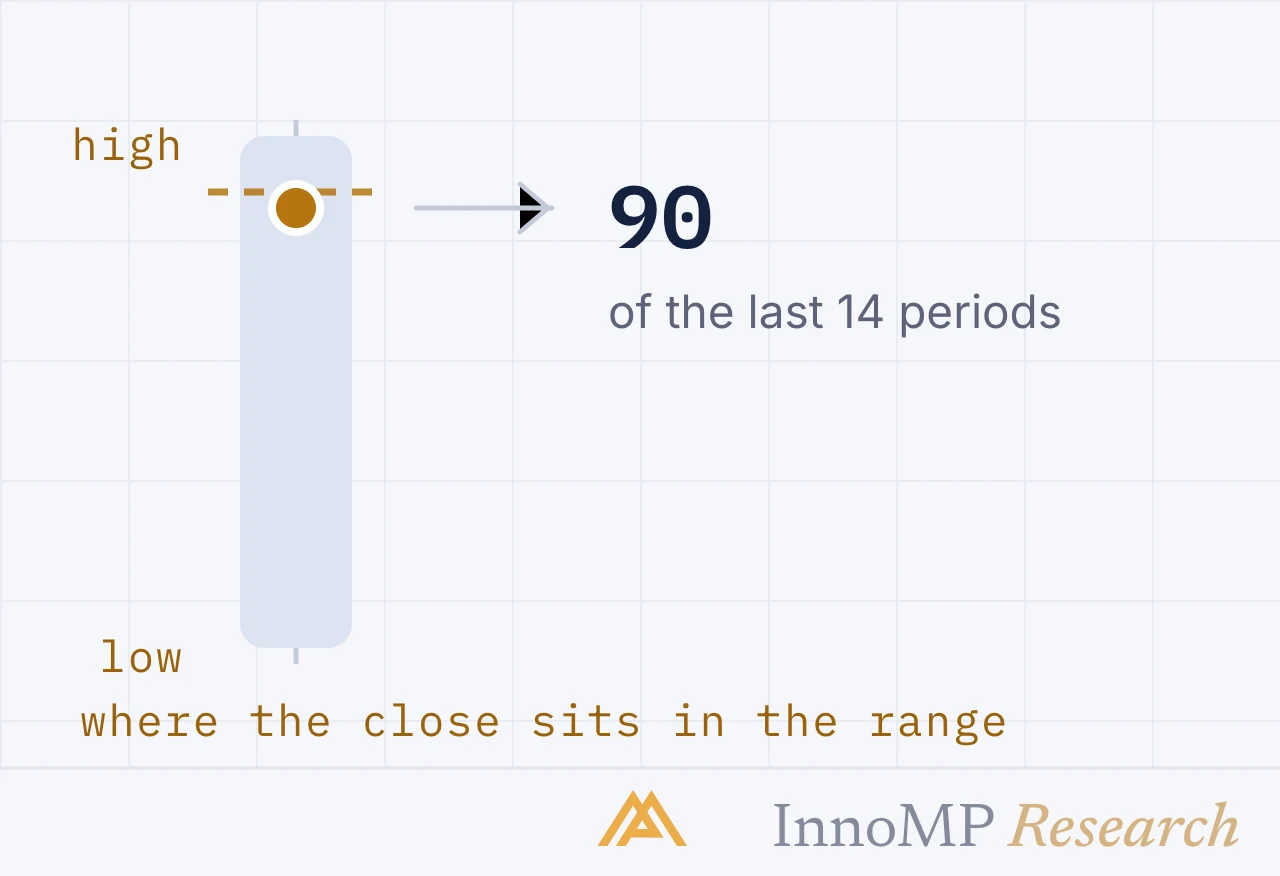
The last oscillator family, and the closing argument of this series: why three indicators measuring the same thing is worse than one, and what to do instead.
Read more → 5 min read
Market structureRisk managementPlatformsTrendMarket hoursCandlesticksChart patternsPosition sizing