Skip to content
Research / Education / Indicators

TA · Foundations · Part 16 of 20

Moving averages: the indicator everything else is built on

A smoothed line of past prices, and the four honest uses it has. Why crossovers lag, and what a moving average genuinely tells you that price alone does not.

InnoMP Research Published 30 Aug 2026 · Updated 02 Sept 2026 7 min read
In short

A moving average is the mean of the last N closing prices, recalculated each period, drawn as a line. A simple moving average weights all periods equally; an exponential moving average weights recent prices more heavily and therefore reacts faster. Moving averages identify trend direction and act as dynamic support and resistance, but they lag by construction and cannot signal a turn before it happens.

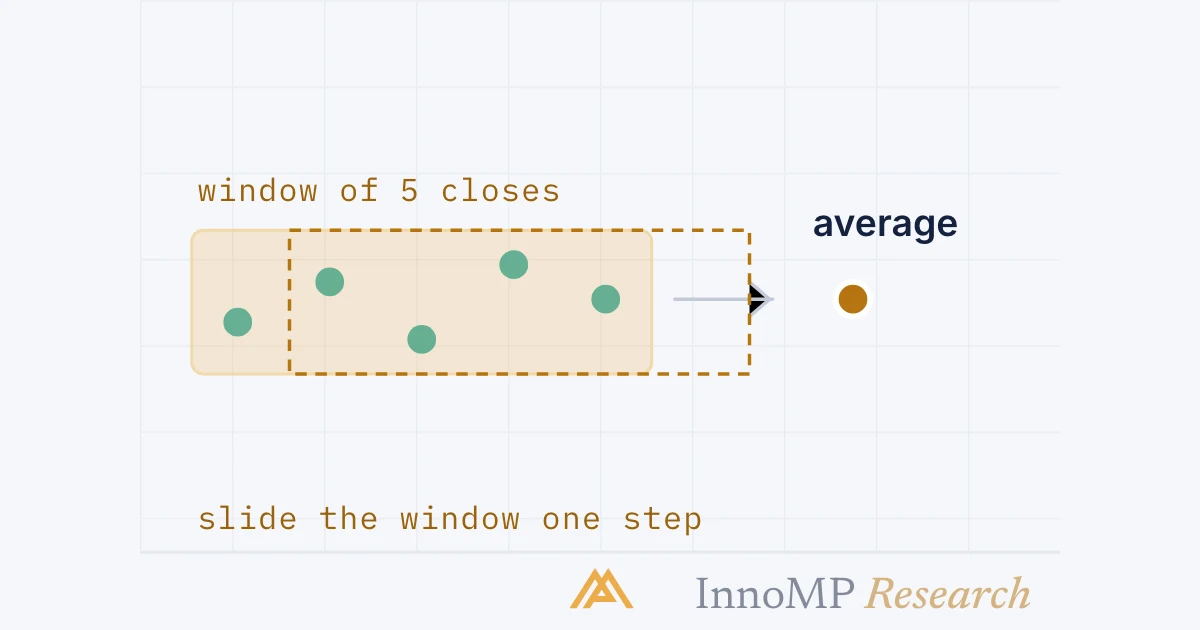
A moving average is the mean of the last N closing prices, recalculated each period. A 20-period moving average on a 4-hour chart averages the last twenty 4-hour closes and plots the result.

How a moving average is calculated from a window of closes A row of closing prices with a bracket covering the last five of them labelled window. An arrow points from the bracket to a single plotted point labelled the average, and a dashed outline shows the window shifting one step to the right to produce the next point. window of 5 closesaveragenext period: slide the window one step → InnoMP Research
Average the window, plot one point, slide the window forward. That is the entire mathematics — everything else is interpretation.

That is the entire mathematics. Everything else is interpretation.

SMA and EMA

A simple moving average and an exponential moving average through a turn A price line that rises then turns down. Two smoothed lines follow it: the exponential average turns down sooner and closer to price, the simple average turns later and stays smoother. EMA turns firstSMA turns laterEMASMA InnoMP Research
The EMA turns sooner, which produces earlier signals and more false ones. The SMA is steadier and later. Neither is better — they sit at different points on the same trade-off.

A simple moving average weights every period in its window equally. A price from twenty periods ago counts as much as yesterday’s, until it drops out of the window entirely.

An exponential moving average weights recent prices more heavily, so it responds sooner to a change in direction.

Neither is superior. The choice is a position on the same trade-off that runs through this entire series: responsiveness versus reliability.

The four honest uses

Trend direction. The most robust use. Price consistently above a rising moving average describes an uptrend; below a falling one, a downtrend. This is not a signal — it is a classification, and it agrees with the swing-structure method more often than not.

Dynamic support and resistance. In a healthy trend, pullbacks frequently stall near a moving average. This works because widely-watched averages attract orders — the same reason round numbers do.

Pullbacks stalling at a rising moving average A rising price line whose three pullbacks each turn around on contact with a rising moving average line beneath it, with each touch point circled. each dip stalls here InnoMP Research
A pullback entry zone that moves with the trend — the Part 9 method with a moving reference instead of a fixed one.

Alignment as a trend filter. When a short, a medium and a long moving average stack in order — short above medium above long, all rising — the trend is aligned across horizons. This is a filter for whether to trade, not a signal for when.

Crossovers. The classic golden cross (50 above 200) and death cross. These are lagging confirmations of trends already well underway, which is why they read impressively on historical charts and frustrate in real time.

The lag is structural

A moving average is calculated from prices that already occurred. It cannot signal a turn before the turn, because the turn is one of its inputs.

This is not a flaw to be tuned away. Shortening the period reduces lag and increases false signals; lengthening it does the reverse. There is no setting that gives fast and reliable, and searching for one is the most common form of indicator over-optimisation.

The practical consequence: use moving averages to describe conditions, not to trigger entries.

Why they fail in a range

Moving averages in a trend and the same averages in a range Two panels. The left shows two separated rising averages with price holding above them. The right shows the same two averages flattened and crossing each other repeatedly as price oscillates sideways, with several crossover points marked. trendingrangingevery cross is a small loss InnoMP Research
A range has no trend to follow. The averages flatten, price crosses them constantly, and a crossover strategy produces a stream of small losses.

Key takeaway Every moving average signal fails in a range, because a range has no trend to follow. This is the Part 4 classification problem, and no indicator setting solves it — only correctly identifying the condition does.

Which periods

The 20, 50 and 200 dominate, and their popularity is self-reinforcing: they work partly because so many participants watch them. A 47-period average may be better optimised on historical data and has nobody trading it.

Common structures:

  • 20 EMA — short-term trend, pullback zone in fast markets
  • 50 SMA — medium-term trend, widely watched pullback level
  • 200 SMA — long-term regime; the single most-watched line in markets
Three moving averages stacked in order through an aligned trend A rising price line above three moving averages arranged in order: the twenty above the fifty, the fifty above the two hundred, all sloping upward. A second section shows the same three tangled together with no clear order. alignedtangled2050200no order — stand aside InnoMP Research
Stacked in order and rising is an aligned trend — a filter for whether to trade. Tangled means the horizons disagree, which is a reason to stand aside.

Two or three is enough. A chart with six moving averages is a chart where one of them always supports whatever you already wanted to do.

Automating the watch

InnoMP’s Market Watcher supports moving-average alerts directly — long/short alignment and crossovers — with adjustable periods and AND/OR combination.

The combination is where it becomes genuinely useful. “Price reaches my level AND the fast MA is above the slow MA” is a far more selective alert than either condition alone, and selectivity is what keeps alerts worth reading.

Next: RSI explained — what an oscillator measures, and why “overbought” does not mean “sell”.

Key facts
  • A simple moving average (SMA) is the arithmetic mean of the last N closes.
  • An exponential moving average (EMA) weights recent prices more heavily and reacts faster.
  • All moving averages lag price, because they are calculated from prices that already occurred.
  • InnoMP Market Watcher can alert on moving-average alignment and crossovers.
Frequently asked questions

What is a moving average in trading?

A line showing the average of the last N closing prices, updated each period. It smooths out short-term fluctuation so the underlying direction is easier to see, at the cost of reacting after price has already moved.

What is the difference between SMA and EMA?

A simple moving average weights every period in its window equally. An exponential moving average gives more weight to recent prices, so it turns sooner after a change in direction — which means faster signals and more false ones.

Which moving average period should I use?

The 20, 50 and 200 periods are the most widely watched, which is part of why they work — many participants act around the same lines. Shorter periods react faster and produce more noise; longer periods are slower and more reliable.

What is a golden cross?

When a shorter moving average crosses above a longer one, commonly the 50 crossing above the 200. The inverse is called a death cross. Both are lagging confirmations of a trend already underway rather than early warnings.

InnoMP Research

Market research, trading education and platform guides from the InnoMP research desk — covering forex, metals, indices and stock CFDs.

Published 30 Aug 2026 · Updated 02 Sept 2026 · Reviewed by InnoMP Compliance

Disclaimer: This content is provided for general informational purposes only and does not constitute investment advice, an offer, or a solicitation to buy or sell any financial instrument. It has been prepared without regard to your individual financial circumstances or objectives. Trading CFDs involves a high risk of loss.

Related notes

Indicators

RSI explained: why overbought does not mean sell

The Relative Strength Index measures the speed of recent gains against recent losses. What the 70 and 30 lines actually mark, and the one RSI signal worth more than either.

7 min read