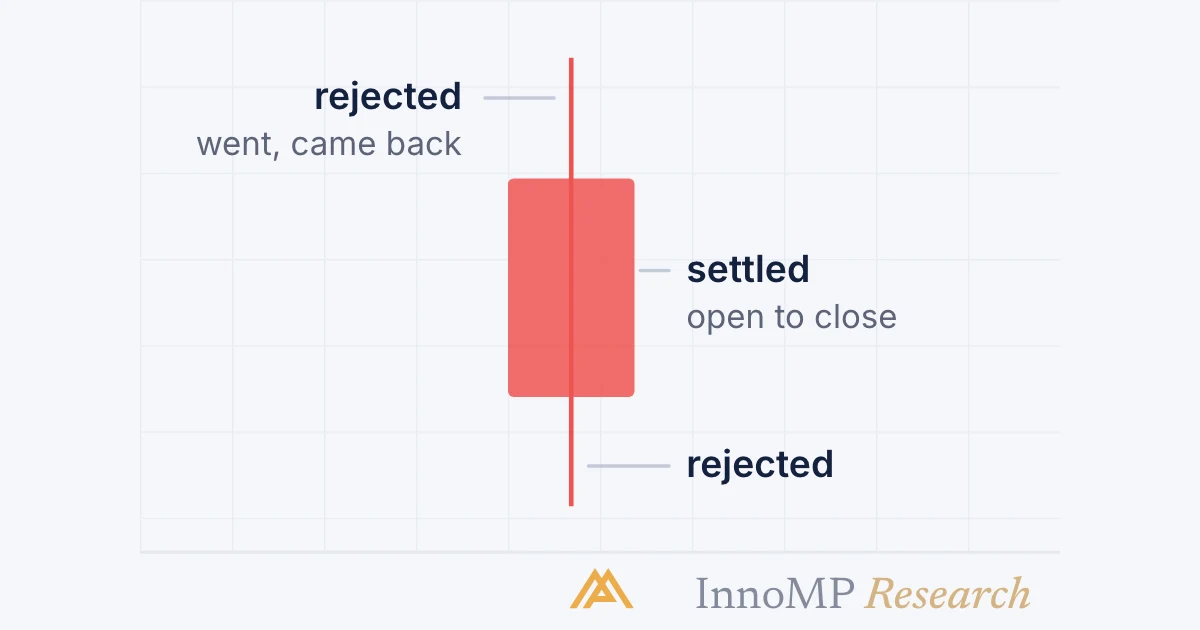
A candlestick's body spans the open and close; its wicks reach the high and low. The body shows what was settled — where the period began and ended. The wicks show what was rejected — prices that were reached and not held. Reading that proportion in context matters more than memorising pattern names.
A candlestick’s body spans the open and close. Its wicks reach the high and low.
Everything a single candle can tell you comes from the proportion between those two things. Learn that proportion and you will not need to memorise pattern names — you will be able to describe any candle on any chart.
Two words: settled and rejected
This is the whole framework.
The body is the settled part. It shows where the period began and where participants were willing to end it. A long body means the close finished far from the open — one side moved price and held the gain into the close.
The wicks are the rejected part. They mark prices that were reached and not sustained. A long wick records a failed attempt: price went there, and enough opposing interest appeared to push it back before the period ended.
The four numbers underneath
Every candle is built from four prices, covered in Part 2. Worth restating because everything here depends on them.
Reading the proportion
Four shapes cover almost everything you will see.
Full body, no wicks. One side controlled from open to close without pushback. Sometimes called a marubozu. Strong conviction.
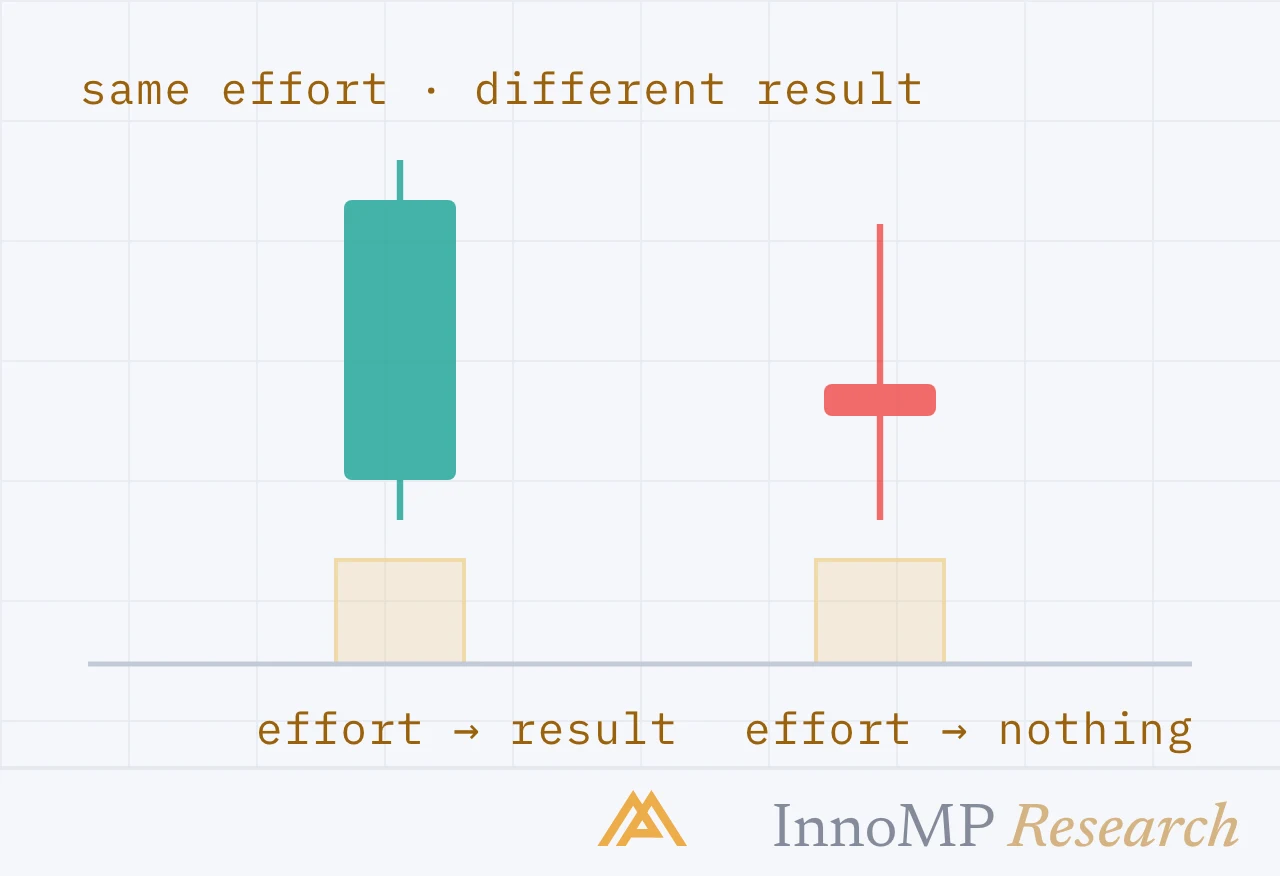
Small body, long wicks both sides. Price covered ground in both directions and came back. Neither side won. After a long move, this is worth noticing — the trend stopped making progress within the period.
Small body at the top, long lower wick. Sellers pushed well down; buyers absorbed it and closed near the high.
Doji. Open and close effectively equal. Pure indecision.
Location decides the meaning
Here is where most candlestick education goes wrong. A candle shape is not a signal by itself.
A long lower wick at a tested support level, after a decline, where swing structure suggests a higher low should form — that is several reasons agreeing, and the candle is the timing signal.
The identical candle in the middle of a range with no level nearby means a wobble happened.
Key takeaway Use candles as confirmation, never as the reason. The sequence that works is: find the level (Part 5), read the structure (Part 7), then watch what candles do when price arrives. Scanning for candle shapes and looking for a level afterwards is the same steps in the wrong order.
Timeframe changes the candle
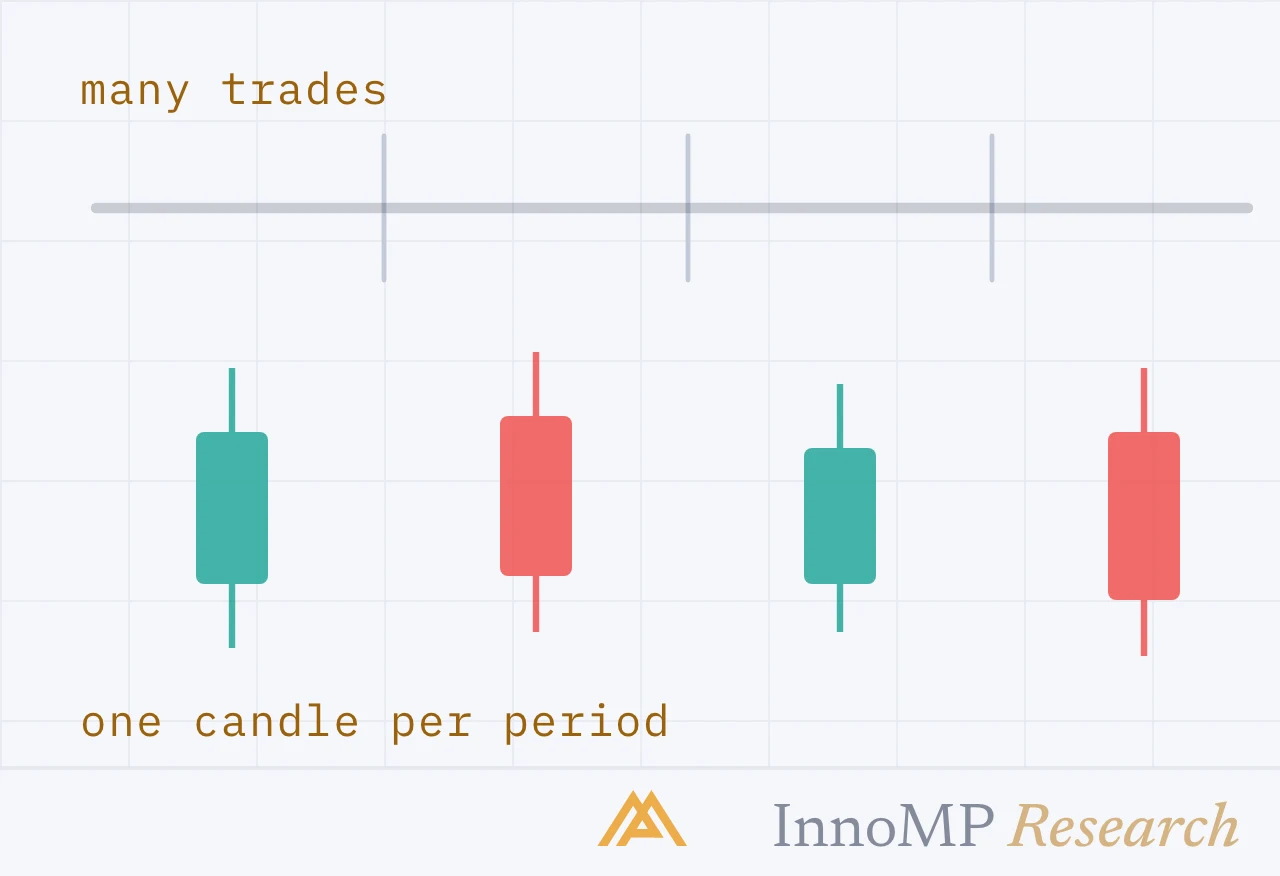
One candle on the daily chart is 24 candles on the hourly. That daily doji with long wicks is an entire day of argument compressed into one shape.
Two consequences. Higher-timeframe candles carry more weight, for the same reason higher-timeframe levels do. And if you want to know how a candle formed — whether that long lower wick was one violent spike or a slow grind down and recovery — drop a timeframe and look. That detail sometimes changes the read entirely.
Next: Candlestick reversal patterns — the named formations worth knowing, and the level context that makes them work.
- The body is the settled part of the period; the wicks are the rejected part.
- A long body means one side controlled the period without meaningful pushback.
- A long lower wick means sellers pushed price down and buyers pushed it back before the close.
- The same candle shape means different things at a level, in mid-range, and after a long trend.