Skip to content
Research / Education / Market structure

TA · Foundations · Part 7 of 20

Swing highs and lows: reading market structure

The skeleton beneath every chart pattern. How to spot the turning points mechanically, and how their order tells you when a trend has actually ended rather than paused.

InnoMP Research Published 30 Aug 2026 · Updated 02 Sept 2026 7 min read
In short

A swing high is a candle whose high is above the candles on both sides of it; a swing low is the mirror. Reading these points in order gives market structure: higher highs with higher lows is an uptrend, lower highs with lower lows is a downtrend. A trend ends when that order breaks — a mechanical test rather than a judgement call.

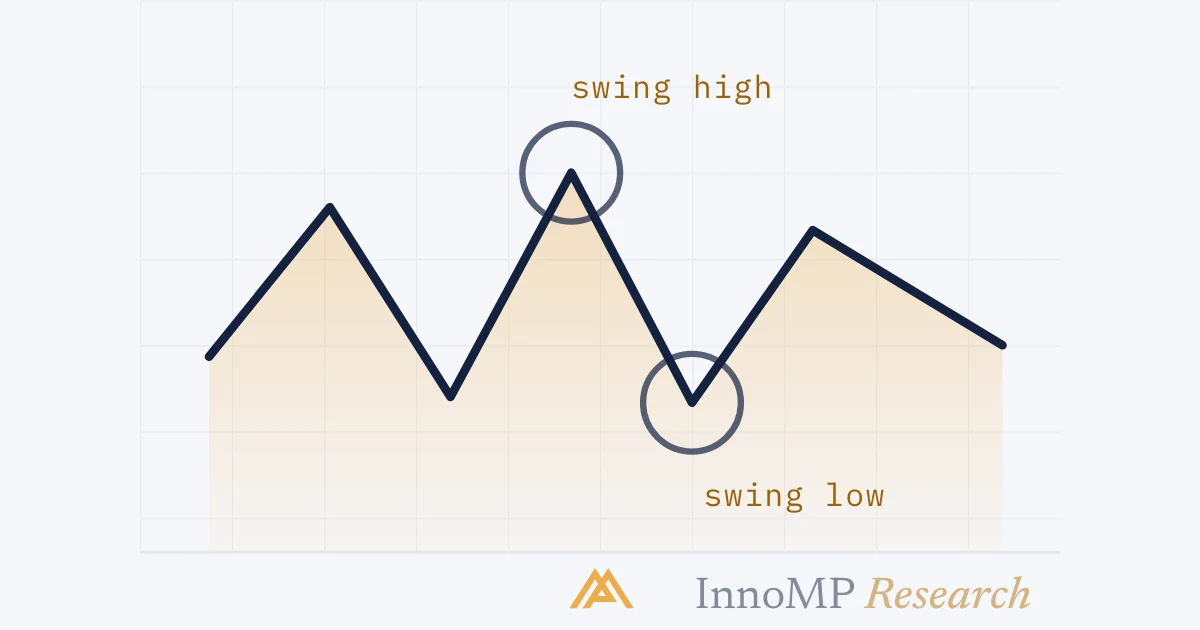
A swing high is a candle whose high is above the candles on either side. A swing low is a candle whose low is beneath the candles on either side.

These points are the skeleton of every chart. Trendlines approximate them, patterns are built from them, and trends are defined by the order they appear in.

Why this beats “it looks bullish”

The value of swing points is that they are mechanical.

“Is this an uptrend?” is a matter of opinion. “Is this peak higher than the last peak?” is not — you can point at it, and two people will agree.

That is the whole reason this part exists before patterns and indicators.

How to identify a swing high and a swing low A zigzag price line with one peak circled and labelled swing high, showing lower candles on both sides, and one trough circled and labelled swing low, showing higher candles on both sides. swing highlower on both sidesswing lowhigher on both sides InnoMP Research
A peak with lower ground on both sides is a swing high. A trough with higher ground on both sides is a swing low. That is the entire definition.

Two practical notes.

Swing points confirm late. A candle is only a swing high once the following candles have failed to exceed it. There is an unavoidable delay between the peak forming and being identifiable — no method removes this.

They are timeframe-specific. A 15-minute swing high may be invisible on the daily chart. When two people disagree about whether structure broke, they are usually reading different timeframes — the Part 3 problem again.

The sequence is the trend

Read the swing points in order and the trend defines itself.

Higher highs and higher lows in an uptrend A rising zigzag price line with three peaks labelled HH for higher high and three troughs labelled HL for higher low, showing both sequences climbing. HHHHHHHLHLHLUptrendhigher highs · higher lows InnoMP Research
Both sequences climbing is an uptrend. Read the peaks against each other, then the dips against each other — two separate checks.
  • Higher high, higher low, repeating — uptrend, intact
  • Lower high, lower low, repeating — downtrend, intact
  • Mixed — range or transition

This gives a precise answer to a question most beginners answer by feel: has the trend ended?

The two events that end a trend

An uptrend does not reverse in one move. It breaks in two steps, and the order matters.

An uptrend ending in two steps: a lower high then a break below the prior low A price line that rises with higher highs and higher lows, then produces a peak lower than the previous peak marked LH as a warning, then falls below the previous trough at a point marked break of structure, after which it continues down. HH1 · LHfailed to exceed the last peak2 · breakbelow the prior dip InnoMP Research
Step one is a warning; step two is confirmation. Between them the trend is in question but not broken.

Step 1 — a lower high. The uptrend is now in question. Not broken. Step 2 — price takes out the previous higher low. Now it is broken.

Until both happen, a decline is a pullback, not a reversal. Getting this wrong causes the two most common trend-trading errors: exiting a good trend at the first dip, and holding a broken trend because it “should” recover.

Key takeaway Structure gives you a sentence you can test: “this uptrend is intact while price holds above [the last swing low].” Entry, stop, invalidation and the decision to stay in can all be derived from that one line.

Why price hunts these levels

Swing points are where stop orders live — and knowing this explains a lot of frustrating price action.

A trader who buys a pullback puts their stop beneath the swing low that defined it, because that is where the idea is wrong. So does the next trader, and the next. A pool of resting sell orders builds just beneath an obvious low.

Resting orders are liquidity, and markets move toward liquidity.

Stop orders clustering beneath a swing low, and price reaching for them A swing low with several small dots gathered just beneath it representing clustered stop orders. The price line dips slightly below the cluster and then reverses sharply upward. obvious swing lowstops cluster heredips through, then reverses InnoMP Research
Price dips through the cluster, fills those stops, then reverses. It feels personal. It is structural — and it is why stops need a buffer.

The response is not to abandon logical stop placement. It is to place stops beyond the swing with a buffer sized to how much the instrument normally moves — and to accept the smaller position that follows, rather than tightening the stop to afford a bigger one.

Using structure in a trade

Direction, entry, stop and exit placed on one swing structure An uptrend with rising swing points. Four markers are placed on it: direction along the overall advance, entry at a pullback, stop below the prior swing low, and exit at the first lower high. 1 · Directionstructure is rising2 · Entry3 · Stop below prior low4 · Exitfirst lower high InnoMP Research
Four decisions, one structure. Each is read from the swing points rather than chosen freely.

Direction — trade with the higher-timeframe structure. Counter-trend trades are lower-probability by construction.

Entry — in an uptrend, the pullback toward the prior swing low is where risk is smallest relative to the move. That is Part 9.

Stop — beyond the swing that would invalidate the read, plus a buffer.

Exit — structure can close a trade too. An uptrend that produces a lower high has changed character, which is a reason to reduce before the stop is hit.

Next: Breakouts and false breakouts — what happens when structure is challenged, and why most challenges fail.

Key facts
  • A swing high has lower highs immediately on both sides of it.
  • Market structure is the sequence of swing highs and lows, read in order.
  • A trend ends when the sequence breaks — this is checkable, not a matter of opinion.
  • Stop orders cluster just beyond swing points, which is why price reaches for them.
Frequently asked questions

What is a swing high in trading?

A candle whose high is higher than the candles immediately before and after it. It marks a local peak where buying stopped and selling took over. Some traders require two or three lower candles on each side to filter out minor peaks.

What is market structure?

The sequence of swing highs and swing lows read in order. Higher highs and higher lows describe an uptrend, lower highs and lower lows a downtrend, and a mixed sequence describes a range or a transition.

What is a break of structure?

When the sequence changes character — for example an uptrend that had been making higher lows produces a low beneath the previous one. It signals the balance between buyers and sellers has shifted.

Why does price often dip just below a swing low before reversing?

Because stop orders cluster just beyond obvious swing points. Those resting orders are liquidity, and markets move toward liquidity. It feels personal but it is structural.

How do I know when a trend has ended?

In an uptrend, watch for two events in order: a peak that fails to exceed the previous peak, then a dip that falls below the previous dip. Until both happen, a decline is a pullback rather than a reversal.

InnoMP Research

Market research, trading education and platform guides from the InnoMP research desk — covering forex, metals, indices and stock CFDs.

Published 30 Aug 2026 · Updated 02 Sept 2026 · Reviewed by InnoMP Compliance

Disclaimer: This content is provided for general informational purposes only and does not constitute investment advice, an offer, or a solicitation to buy or sell any financial instrument. It has been prepared without regard to your individual financial circumstances or objectives. Trading CFDs involves a high risk of loss.

Related notes

Support & resistance

How to draw trendlines and channels correctly

A trendline is support and resistance that moves. This guide shows how to draw one that is defensible, why two touches are not enough, and what a channel adds.

7 min read