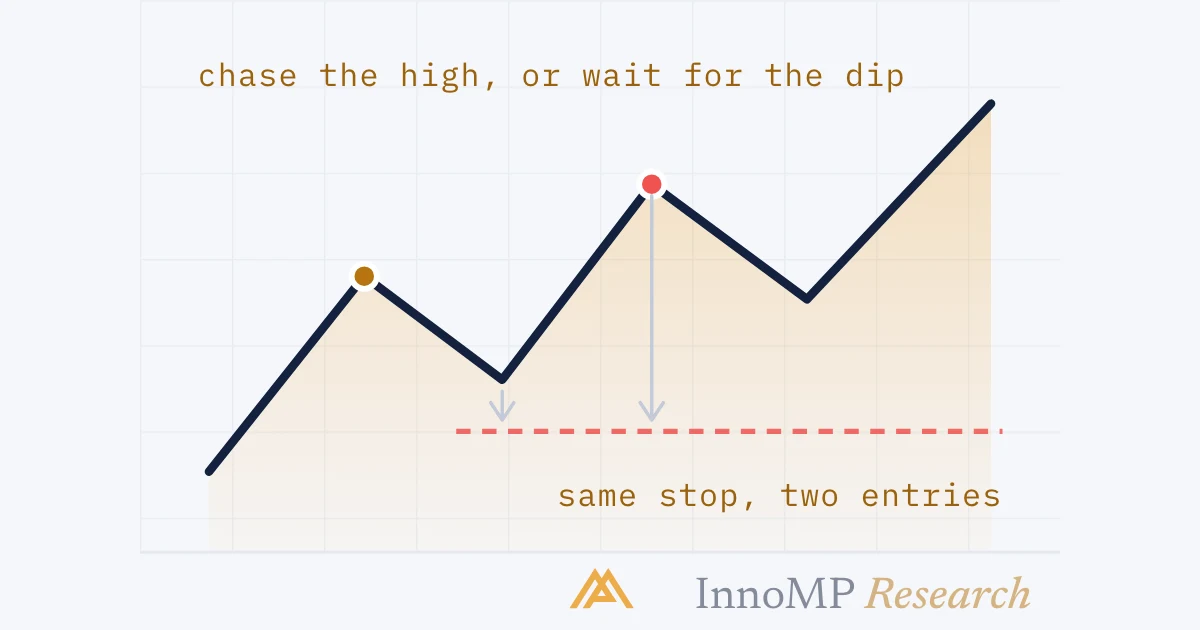
A pullback is a temporary move against the trend before it resumes. Entering during a pullback places your stop closer to the point where the idea fails, which means a smaller stop distance and a larger position for the same risk. A move that falls below the previous swing low in an uptrend is no longer a pullback — it is a break of structure.
A pullback is a temporary move against the trend that does not break its structure.
Trends do not advance in straight lines. They advance, pause while some traders take profits, then advance again. Those pauses are where trend entries belong — and the reason is arithmetic, not aesthetics.
The same trade at two prices
This is the most valuable single idea in this part. Take an uptrend where the last swing low — the point where the idea fails — sits at 1.0840.
Put numbers on it. Price rallied from 1.0800 to 1.0900, stop goes just under 1.0840 at 1.0835.
By the position-sizing formula, the pullback entry supports a position over three times larger for the same 1% risk. And because you entered lower, the target is further away — so the risk-reward ratio improves from both ends at once.
This one habit does more for a trend strategy than most indicator work.
How deep is too deep
Two answers, and only one is definitive.
The structural answer. In an uptrend, once price closes beneath the previous swing low, the higher-low sequence is broken. It is no longer a pullback — it is the break of structure from Part 7. Percentage depth is irrelevant next to this test.
The probabilistic answer. Shallow pullbacks suggest strong demand — buyers would not wait for a better price. Deep pullbacks approaching the prior low suggest the trend is weakening even while technically surviving.
Fibonacci levels, honestly
Fibonacci retracements — 23.6%, 38.2%, 50%, 61.8%, 78.6% — are drawn across a completed move to mark where a pullback might end.
They are worth using, and worth being honest about. There is no mechanism by which markets must respect ratios from a number sequence. What there is: an enormous number of traders drawing the same levels on the same moves and placing orders there. That makes them real in the only way that matters for trading — as places where orders cluster.
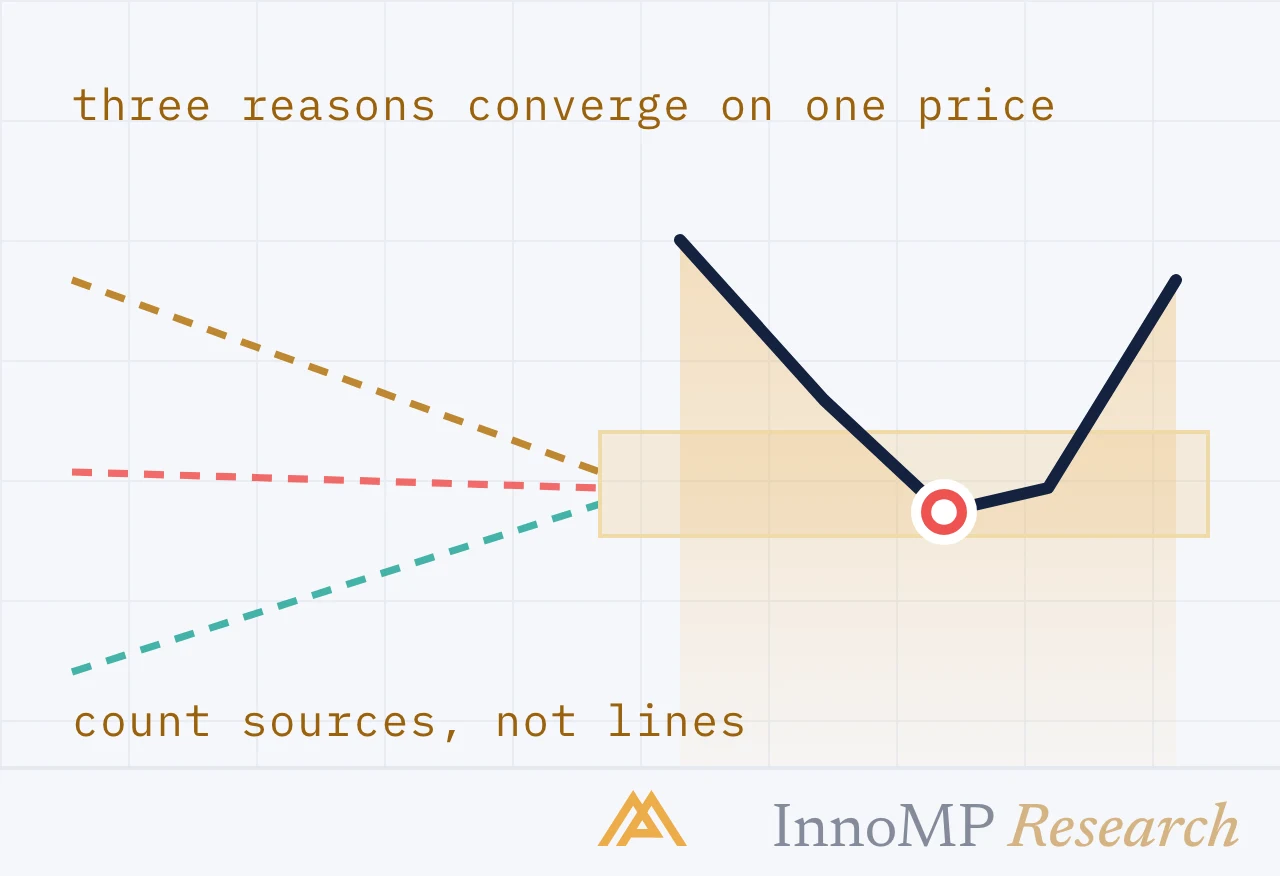
Two practical notes. The 50% level is not a Fibonacci ratio at all, and it is watched as much as any of them. And these levels matter most where they coincide with something independent — a prior swing low, a horizontal level from Part 5, a trendline from Part 6.
Key takeaway The most common error in trend trading is not being wrong about direction — it is being right about direction at the wrong price. A correct read entered at the extreme produces a wide stop, a small position and a poor ratio: a losing configuration built on a winning idea.
Waiting without missing out
The obvious objection: sometimes the pullback never comes and price runs away.
True — and that is the cost of the method. It is worth paying, because the alternative is chasing every extension and paying the widest stop distance on every trade, including the ones that fail.
Two things reduce the friction. Set a Market Watcher alert at your pullback zone and let it notify you instead of watching. And accept that a trader who takes only good entries takes fewer trades — that is the goal, not a compromise.
The checklist
- Is the trend intact? Swing structure, from Part 7.
- Where is invalidation? The prior swing low in an uptrend.
- Is it still a pullback? Has it held above that point?
- Is there confluence? A level, a trendline, a retracement — ideally more than one.
- What size does the stop distance permit? Calculate it; do not estimate.
Next: Candlestick anatomy — what a single bar tells you about the fight that produced it.
- A pullback moves against the trend without breaking its swing structure.
- Entering on pullbacks shrinks stop distance, which increases position size for the same risk budget.
- Common retracement depths are 38.2%, 50% and 61.8% of the prior move.
- A retracement below the previous swing low in an uptrend ends the trend by definition.