Skip to content
Research / Education / Market structure

TA · Foundations · Part 8 of 20

Breakouts and false breakouts: why most breaks fail

The break of a level is the most-watched event on any chart and the least reliable. What separates a break that holds from one that traps you.

InnoMP Research Published 30 Aug 2026 · Updated 02 Sept 2026 7 min read
In short

A breakout is price moving decisively beyond a support or resistance level. A false breakout is price moving beyond it and then returning inside, trapping the traders who entered on the break. False breakouts are common because stop orders resting beyond a level create the very liquidity that pushes price through it, without any lasting change in supply and demand.

A breakout is price moving decisively beyond a level. A false breakout is price moving beyond it and coming back.

The break is the most-watched event on any chart — which is exactly why it is unreliable. Everyone is looking at the same line, and a great many of them have orders resting just beyond it.

Why so many breaks fail

This is worth understanding properly, because it explains behaviour that otherwise feels like the market is out to get you.

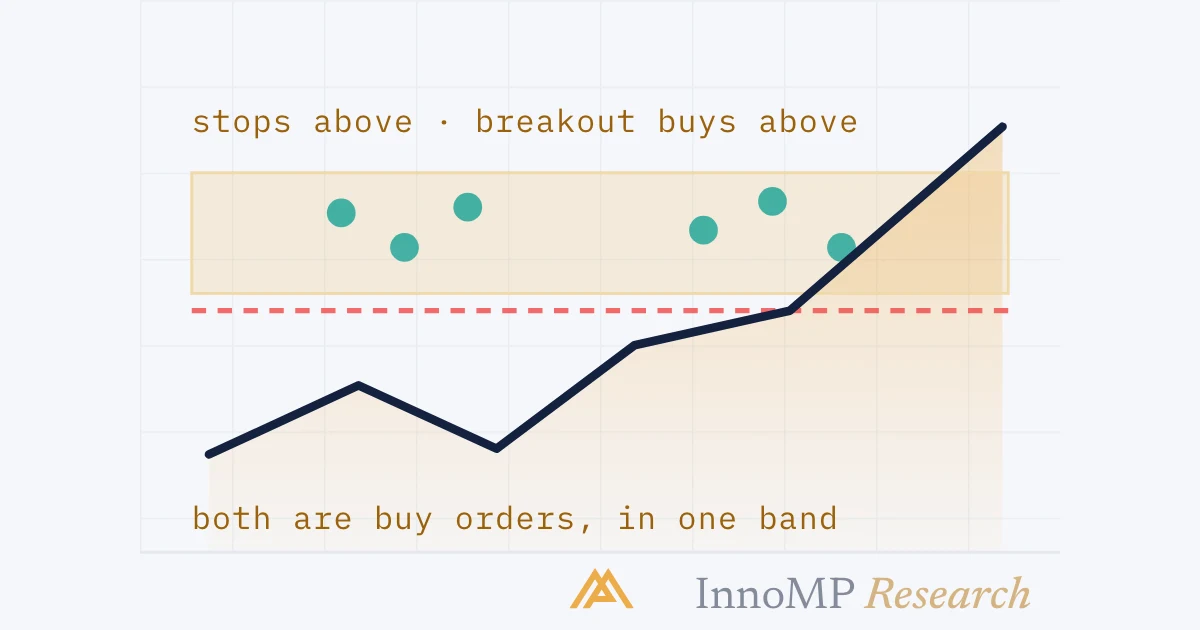
Suppose resistance sits at 1.0900, tested three times. Above that level, two kinds of order are waiting:

  • Stop-losses from traders who are short
  • Buy orders from traders wanting to enter on a break

Both are buy orders. Both sit in a narrow band just above the level.

Why buy orders pile up just above a resistance level A horizontal resistance line with two labelled groups of dots above it: stop-losses from short sellers and buy orders from breakout traders. A note explains both are buy orders clustered in the same band. resistance 1.0900Above: all buy orders· short sellers’ stop-losses· breakout traders’ buy orderspacked into one band InnoMP Research
Two different groups, same side of the trade, same narrow band. That concentration is what a large seller needs to fill into.

Now: a large participant who needs to sell size has a problem. Selling into a quiet market pushes the price against them.

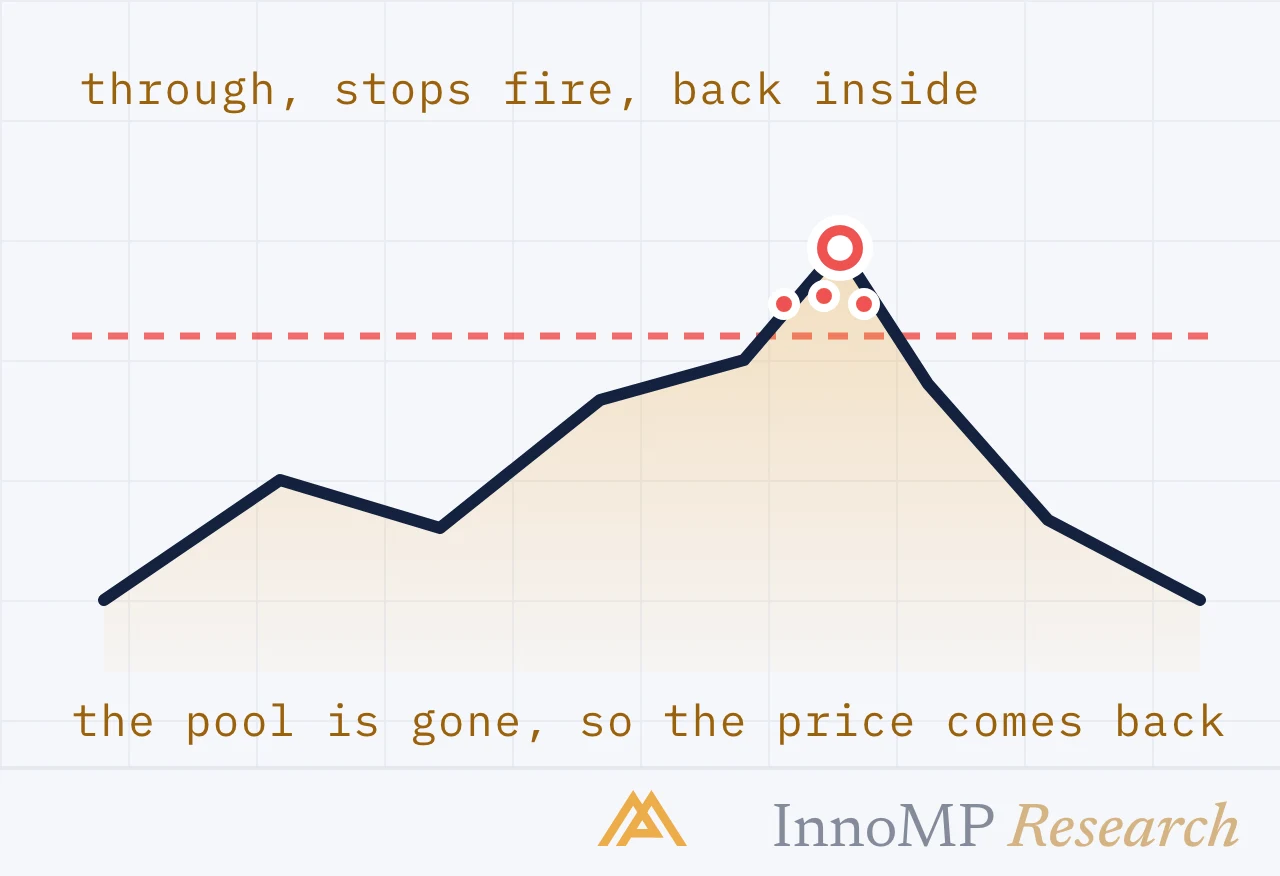
But if price can be nudged through 1.0900, all those resting buy orders execute — providing exactly the counterparty they need. Price spikes through, the orders fill, the seller distributes, and price falls back inside.

Nothing about supply and demand changed. The level was not broken; it was harvested.

A false breakout compared with a genuine one that retests Two panels sharing a horizontal resistance line. On the left price spikes above the line and immediately falls back inside, marked false break. On the right price closes above the line, pulls back to touch it from above, holds, and continues higher. resistanceFalse breakspike, then back insideReal breakclose beyond, retest holds InnoMP Research
Left: through and straight back inside. Right: a close beyond, a pullback that holds the level from above, then continuation.

Key takeaway This is not a conspiracy — it is how liquidity works in any auction market. The lesson is not that breaks are traps, but that a break is a claim that needs evidence, and the evidence arrives after the break, not during it.

Four pieces of evidence

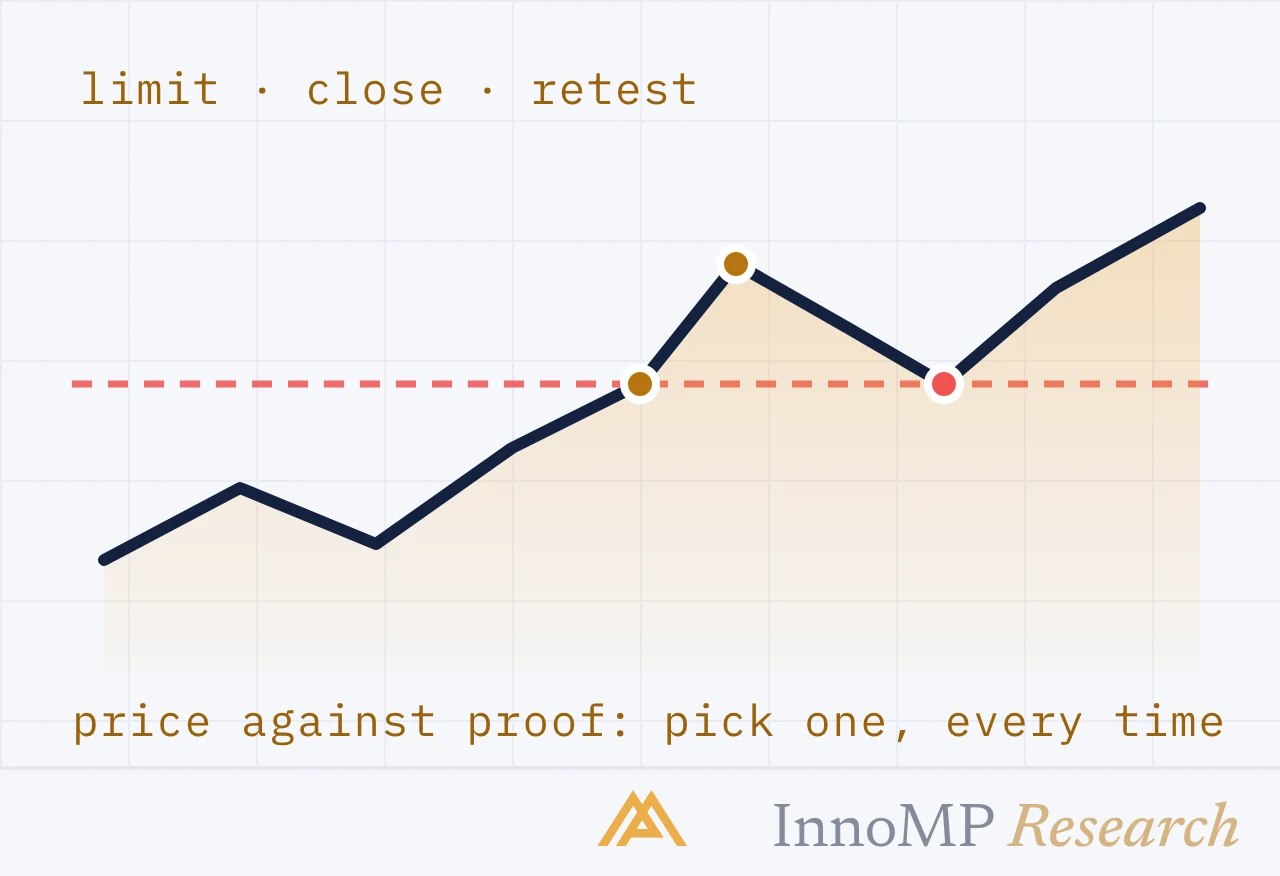
1 · A close beyond the level. A wick through resistance means price reached there and was rejected. A close beyond means it was accepted. Use the timeframe you actually trade — a 4-hour close carries more weight than a 5-minute one, for the reason in Part 3.

2 · Follow-through. A genuine break usually continues in the next few candles. A break that immediately stalls — small indecisive candles just beyond the level — is telling you the buyers who pushed through have stopped buying.

3 · A retest that holds. The strongest confirmation available. Price breaks, pulls back to the broken level, and is rejected from the new side. That is the flip from Part 5: old resistance now acting as support, which means participants have repriced it.

4 · Context. Breaks in the direction of the higher-timeframe trend succeed more often. A break out of a range that has been narrowing has more behind it than one from a wide, indecisive range.

Two ways to trade it

Entering on the break compared with entering on the retest A resistance level broken by price. One entry marker sits at the break with a long arrow down to a stop back inside the range. A second entry marker sits at the retest with a much shorter arrow to a stop just below the level. stop if entering on the breakA · breakB · retest InnoMP Research
Same idea, two entries. The retest gives up the first thrust and buys a much tighter stop — which means a bigger position for the same risk.

Enter on the break. You capture the full move when it works. You also take every failure, and your stop must sit back inside the range — a wide stop, which by position-sizing arithmetic means a small position.

Wait for the retest. You give up the initial thrust. In exchange you get confirmation, a much tighter stop just beyond the retested level, and therefore a better risk-reward ratio on the same target. The cost is the breaks that never retest — you simply do not trade those.

Neither is better in the abstract. The retest approach suits anyone who cannot watch continuously, since a retest is something a Market Watcher alert can notify you about.

A breakout that stalls immediately compared with one that follows through Two panels sharing a horizontal level. On the left price closes just above the level then produces several tiny indecisive candles going nowhere. On the right price closes above and continues with larger candles in the same direction. Stallstiny candles,no follow-throughFollows throughlarger candles,same direction InnoMP Research
The candles right after the break tell you whether anyone is still buying. Small and directionless means the push is over.

When breaks fail most

Liquidity conditions matter as much as the chart:

  • Around scheduled news — spreads widen and the first move frequently reverses. See the calendar playbook.
  • In quiet sessions — fewer participants behind the break. See market hours.
  • At round numbers — order clustering is heaviest exactly where breaks are most watched.
  • Into a weekend — a Friday break carries gap risk no stop can manage.
Conditions where breakouts fail more often Four stacked rows naming risky conditions for breakouts: scheduled news, quiet sessions, round numbers, and going into a weekend, each with a one-line reason. Scheduled newsspreads widen, first move often reversesQuiet sessionsfewer participants behind the breakRound numbersstops pile up where breaks are most watchedInto a weekendgap risk no stop can manage InnoMP Research
Four situations where a break has less behind it than it looks. None of them is visible on the chart itself — you have to know the clock and the calendar.

The failure is a signal too

One last thing worth knowing: a false breakout is information, not just a failed trade.

Price that fails to hold above resistance and closes back inside has demonstrated that sellers still control the level. That failure often produces a faster move in the opposite direction than the break would have produced in its own.

Next: Pullbacks and retracements — where trend entries actually belong.

Key facts
  • A breakout is only confirmed once price closes beyond the level, not merely wicks through it.
  • Stop orders beyond a level are buy orders that can push price through without real demand.
  • Waiting for a retest gives up part of the move in exchange for confirmation and a tighter stop.
  • Breaks into thin liquidity — news, session gaps, weekends — fail more often.
Frequently asked questions

What is a false breakout?

Price moves beyond a support or resistance level, appearing to break it, then returns back inside. Traders who entered on the break are left holding positions in the wrong direction, and their exits often accelerate the reversal.

How can you tell if a breakout is real?

No method is certain, but three things raise the odds: price closing beyond the level rather than just wicking through, follow-through in the next candles rather than an immediate stall, and a retest of the broken level that holds from the other side.

Should I trade the breakout or wait for the retest?

Trading the break captures more of the move but includes every failure. Waiting for the retest filters many failures and allows a tighter stop, at the cost of missing breakouts that never look back.

Why do stops get triggered right at breakout levels?

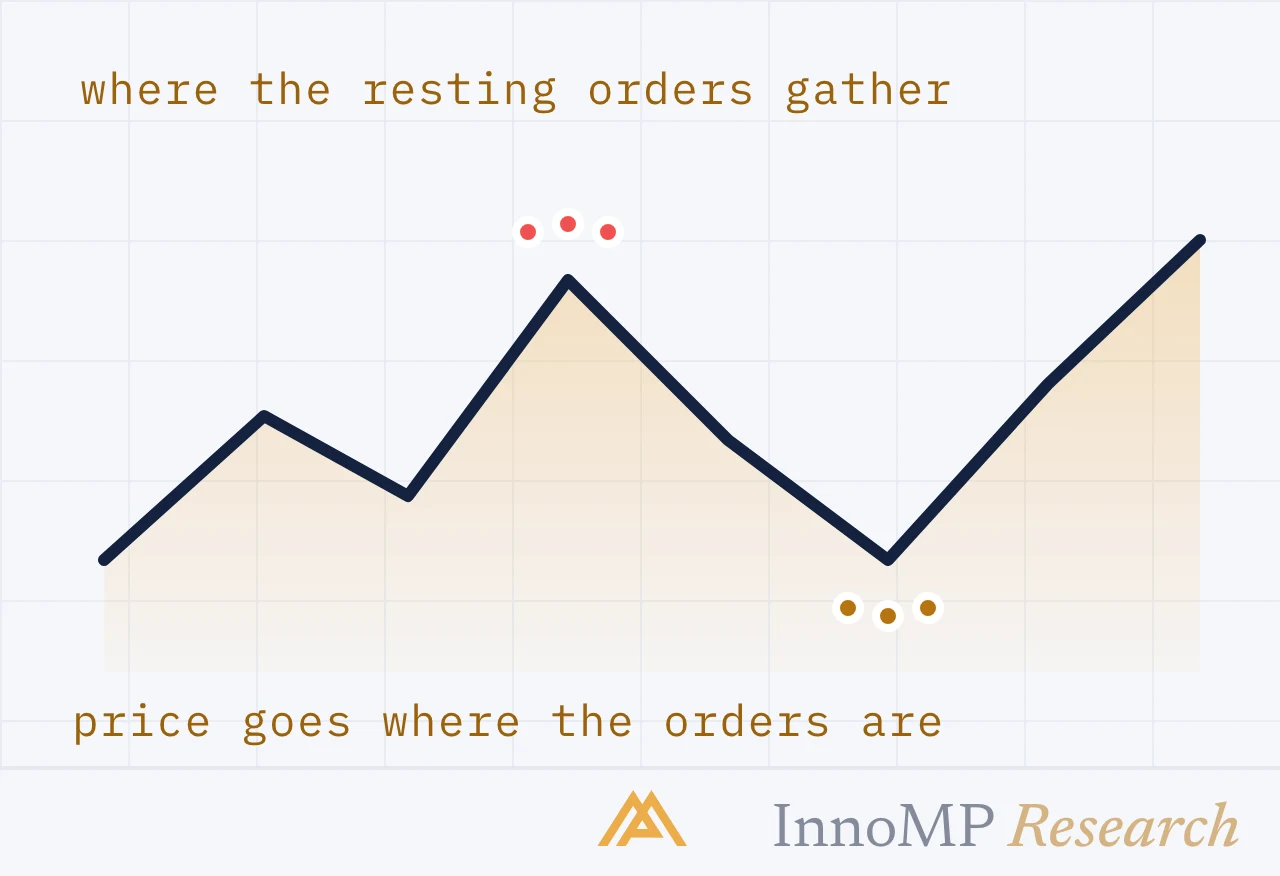
Stops cluster just beyond obvious levels, and those resting orders are liquidity. Participants who need to fill large orders are drawn to where that liquidity sits, which pushes price through the level even when nothing has really changed.

When are breakouts most likely to fail?

In thin liquidity — around scheduled news, in quiet sessions, at round numbers where stops pile up, and going into a weekend when the market will be closed.

InnoMP Research

Market research, trading education and platform guides from the InnoMP research desk — covering forex, metals, indices and stock CFDs.

Published 30 Aug 2026 · Updated 02 Sept 2026 · Reviewed by InnoMP Compliance

Disclaimer: This content is provided for general informational purposes only and does not constitute investment advice, an offer, or a solicitation to buy or sell any financial instrument. It has been prepared without regard to your individual financial circumstances or objectives. Trading CFDs involves a high risk of loss.

Related notes

Support & resistance

Support and resistance explained for beginners

The most useful lines on any chart, and the most commonly drawn wrong. What these levels actually are, how to draw them as zones, and why a broken support becomes resistance.

8 min read
Support & resistance

How to draw trendlines and channels correctly

A trendline is support and resistance that moves. This guide shows how to draw one that is defensible, why two touches are not enough, and what a channel adds.

7 min read