Skip to content
Research / Education / Trend

TA · Foundations · Part 4 of 20

Trend or range? How to tell what a market is doing

Before any indicator or pattern, answer one question: is this market going somewhere or going sideways? Getting it wrong means every tool you use afterwards is the wrong tool.

InnoMP Research Published 30 Aug 2026 · Updated 01 Sept 2026 7 min read
In short

A market is trending when each peak is higher than the last and each dip is also higher (an uptrend), or when both are progressively lower (a downtrend). It is ranging when peaks and dips keep stopping at the same two levels. Trend strategies buy strength; range strategies buy weakness. Applying one in the other's conditions is the most common cause of steady losses.

Before choosing an indicator, a pattern, or an entry, answer one question: is this market trending or ranging?

Almost every technical tool assumes one of those two conditions and misfires in the other. Getting this wrong is more expensive than any entry mistake, because it means your whole toolkit is pointed at the wrong situation.

The two conditions, defined simply

Forget how a chart “feels.” Look at the peaks and dips in order.

Uptrend — each peak is higher than the last, and each dip is also higher than the last. Buyers keep paying more; sellers cannot push price as low as before.

Downtrend — the mirror. Each peak lower, each dip lower.

Range — neither. Peaks keep stopping near one price, dips near another, and price bounces between them without getting anywhere.

An uptrend, a downtrend and a range side by side Three small charts. The first shows a rising line with each peak and dip higher than the previous, marked with upward labels. The second shows a falling line with each peak and dip lower. The third shows a line oscillating between two horizontal dashed boundaries without net progress. Uptrend — higher peaks, higher dipsDowntrend — lower peaks, lower dipsRange — peaks and dips repeat InnoMP Research
Three conditions, one test: are the peaks and dips climbing, falling, or repeating? That is the whole classification.

Notice that these definitions rest on peaks and dips, not on impressions. “It looks bullish” is not a test you can apply consistently. “The last peak was higher than the previous peak” is. Part 7 covers how to identify those points precisely.

Why this decides your whole approach

The two conditions demand opposite behaviour. Read the first row carefully:

TrendRange
Buy whenPrice is strong, on dipsPrice is weak, at the bottom
Sell whenPrice is weak, on ralliesPrice is strong, at the top
Stop goesBeyond the last dipBeyond the boundary
What kills itA choppy sideways marketA decisive breakout

A trend trader buys strength. A range trader buys weakness. These are not variations — they are opposite instructions.

The same price move traded correctly in a trend and in a range Two panels. The left shows a rising trend with a buy marker placed on a dip and a note that says buy strength on pullbacks. The right shows a range with a buy marker at the lower boundary and a sell marker at the upper boundary, with a note that says fade the extremes. In a trendbuy the dips(buying strength)In a rangebuy the bottom,sell the top InnoMP Research
Same rising price, two correct answers depending on the condition. Applying the wrong one means being run over repeatedly by a market doing nothing unusual.

Someone applying range logic to a trending market sells every new high and gets run over. Someone applying trend logic in a range buys every breakout and gets faded each time. Neither has a bad method — both applied a good method to the wrong condition.

Key takeaway Markets spend more time going sideways than trending. So a trend strategy producing a string of small losses is usually not broken — it is being run through a sideways stretch, which is exactly what reading a drawdown calls being out of season rather than broken.

Spotting the change

Transitions are where money moves fastest, and they show up in the peaks and dips before they become obvious.

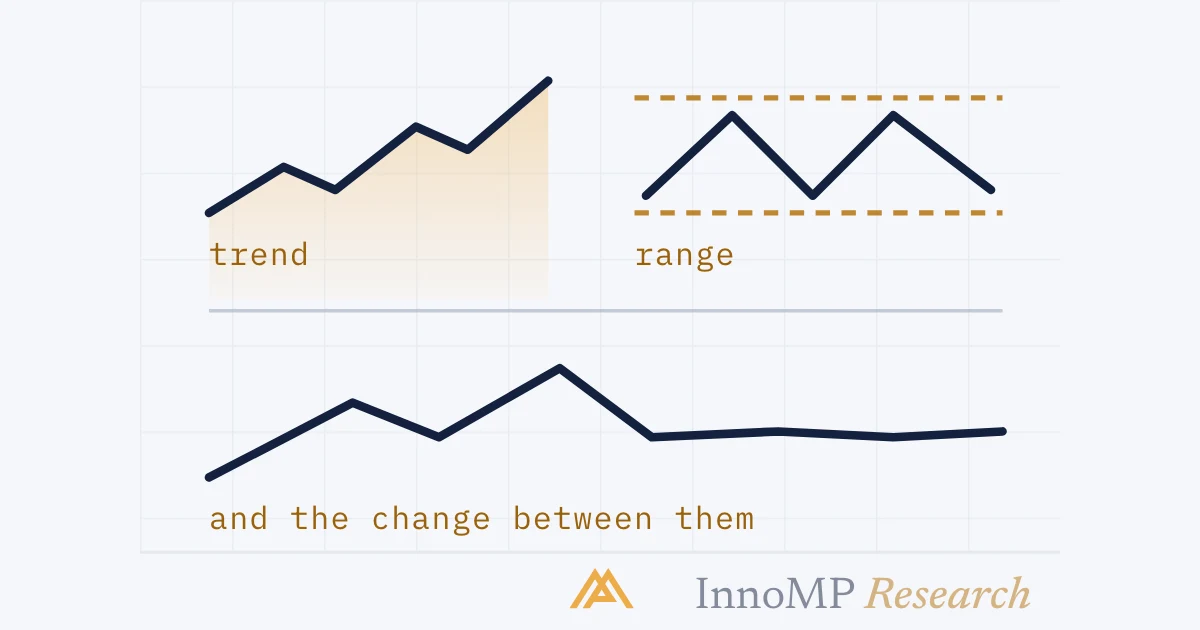
Trend turning into a range. A rally fails to exceed the previous peak, then the dip holds. The higher-peak sequence broke without a reversal — that is consolidation beginning.

Range turning into a trend. A boundary breaks and price fails to get back inside. Most breaks fail, which is why Part 8 is devoted entirely to false breakouts.

An uptrend flattening into a range A price line that makes three rising peaks and then produces a peak that fails to exceed the previous one, after which the line settles into a sideways range between two horizontal dashed boundaries. this peak failedto exceed the lastnow a range InnoMP Research
The trend does not reverse — it stops progressing. The failed peak is the first sign; the flat boundaries confirm it.

One flat stretch is not a range. Two touches of each boundary is the practical minimum before treating something as a range worth trading — two points define a level, one defines nothing.

What happens when a range strategy is used in a trending market A rising price line with four sell markers placed at each new high, each followed by the price continuing higher. A note explains that fading every new high in a trend produces repeated losses. sellsellsellsellFour sells, four lossesthe market did nothing unusual —it simply kept trending InnoMP Research
Selling every new high is correct in a range and ruinous in a trend. The method was not wrong — the condition was misread.

Apply it before every trade

Three questions, in order, before considering any setup:

  1. On my higher timeframe, what are the peaks and dips doing? Climbing, falling, or repeating?
  2. If repeating, where are the boundaries? Draw them. If you cannot draw them cleanly, the market may be in transition — a reason to trade smaller or stand aside.
  3. Does my intended trade match the condition I just identified? If not, the trade is wrong no matter how good the entry looks.
Three questions asked in order before a trade Three stacked boxes numbered one to three. The first asks what the peaks and dips are doing, the second asks where the boundaries are, the third asks whether the intended trade matches the condition, with an arrow flowing downward through them. 1 · Climbing, falling, or repeating?read the higher timeframe first2 · If repeating, where are the edges?cannot draw them cleanly → transition3 · Does my trade match that condition?if not, the entry quality is irrelevant InnoMP Research
Thirty seconds, in this order. The third question stops more losses than any entry technique.

That third question prevents more losses than any entry technique, and it costs thirty seconds.

Next: Support and resistance — the levels that create ranges, and the reason trends pause where they do.

Key facts
  • An uptrend makes higher highs and higher lows; a downtrend makes lower highs and lower lows.
  • A range has highs stopping near one level and lows stopping near another.
  • Markets spend a large share of their time ranging rather than trending.
  • Trend and range strategies give opposite instructions, so one must be switched off when the other applies.
Frequently asked questions

How do I know if a market is trending?

Look at the peaks and dips in order. In an uptrend each peak is higher than the previous peak and each dip is higher than the previous dip. If either sequence breaks, the trend is in question.

What is a trading range?

A period where price bounces between a level above and a level below without making progress. Peaks cluster near one price and dips near another, and price keeps reversing between them.

Is trending or ranging more common?

Ranging. Markets spend much of their time going sideways, which is why trend-following approaches typically produce many small losses punctuated by a few large wins — the small losses are the sideways periods.

Why do trend and range strategies conflict?

A trend trader buys strength, expecting it to continue. A range trader sells strength, expecting it to reverse at the boundary. These are opposite instructions, so running both at once means one of them is always wrong.

How do I trade the change from range to trend?

The change shows as a decisive break of one boundary followed by a failure to get back inside it. Trading the first break is lower-probability because most breaks fail; waiting for price to retest the broken boundary and hold gives up some move for confirmation.

InnoMP Research

Market research, trading education and platform guides from the InnoMP research desk — covering forex, metals, indices and stock CFDs.

Published 30 Aug 2026 · Updated 01 Sept 2026 · Reviewed by InnoMP Compliance

Disclaimer: This content is provided for general informational purposes only and does not constitute investment advice, an offer, or a solicitation to buy or sell any financial instrument. It has been prepared without regard to your individual financial circumstances or objectives. Trading CFDs involves a high risk of loss.

Related notes