Market structure
How to trade US100 CFDs: a framework for the Nasdaq-100
Same direction as the S&P 500, bigger swings. Why the Nasdaq-100 moves more, how concentrated it may be, the one-contract lot, and sizing at a higher level.
9 min read
Reading what price is actually doing — levels, swings, breaks and pullbacks.
43 articles
Same direction as the S&P 500, bigger swings. Why the Nasdaq-100 moves more, how concentrated it may be, the one-contract lot, and sizing at a higher level.
The dollar is on one side of 88% of currency trades, the euro on 30%. What moves EURUSD, the contract, the two central banks, and sizing for a liquid pair.
The fourth most traded currency, a day that starts at 08:00 London, a 07:00 inflation print into a thin book, a noon Bank of England. Drivers, contract, sizing.
A CFD on crude tracks a monthly futures contract, which changes how oil moves and what it costs to hold. Drivers, the roll, the Wednesday report, and sizing.
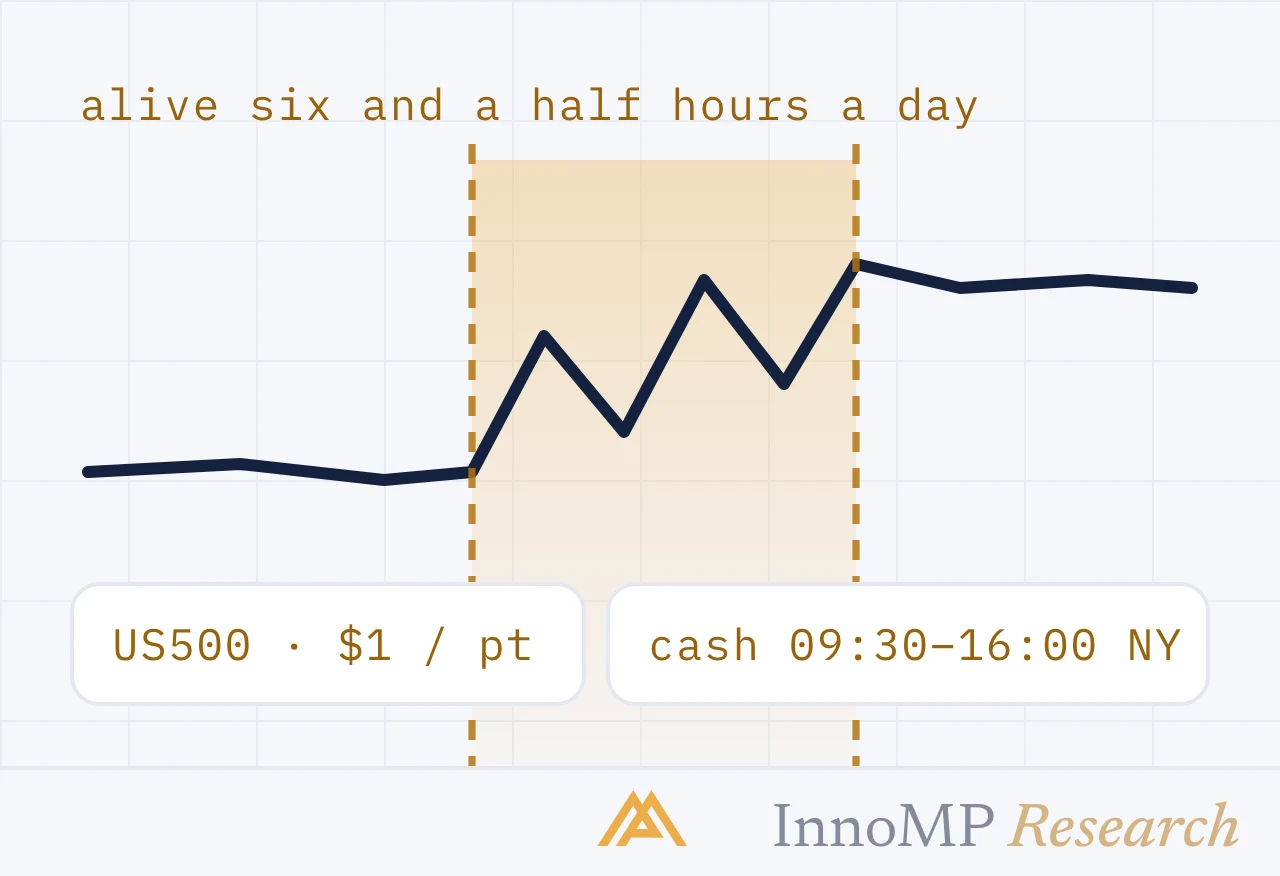
An index CFD quotes all day but is alive for six and a half hours. What moves the S&P 500, the one-contract lot, the cash session, and sizing for an index.
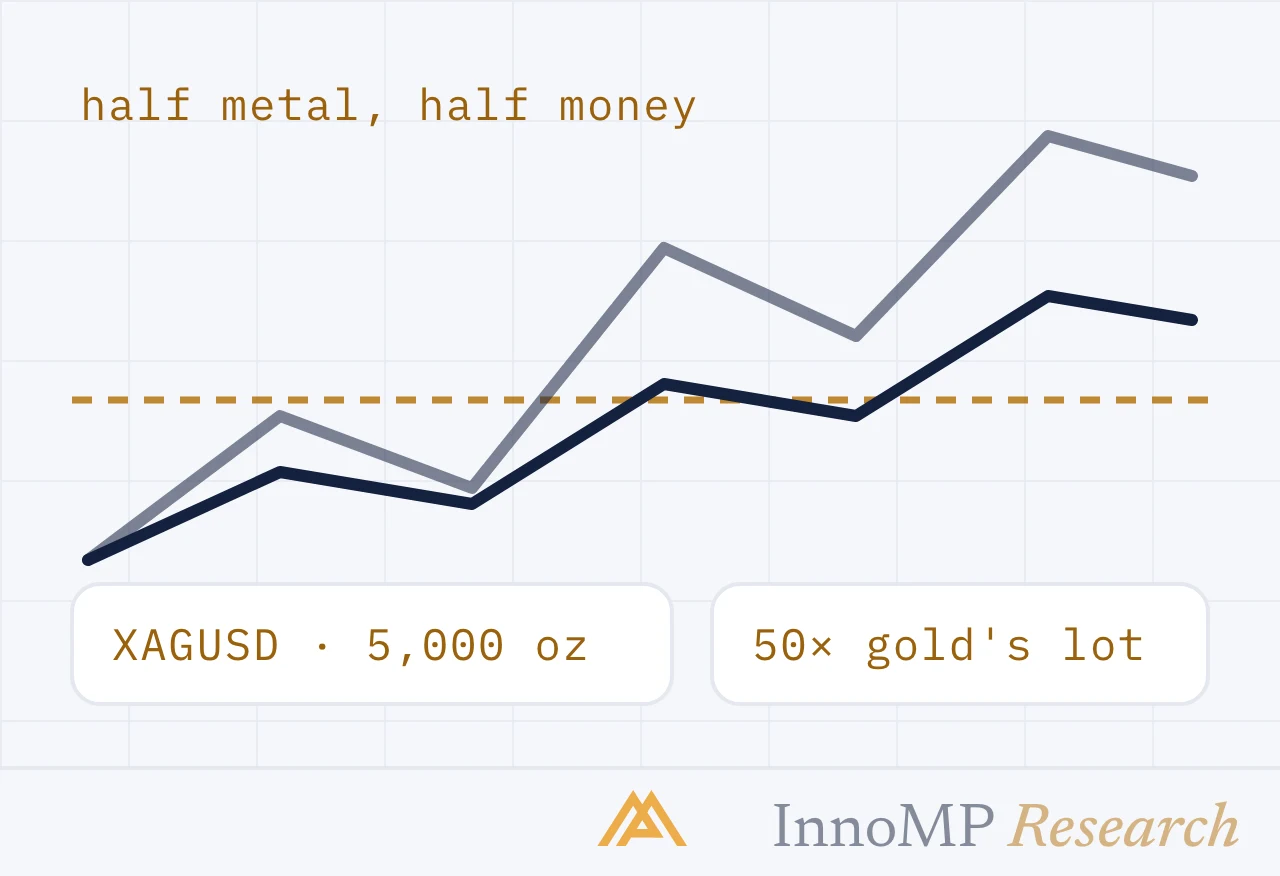
Silver is half metal and half money, so it moves more than gold both ways. What drives it, how the 5,000-ounce contract is sized, and how to size for its range.
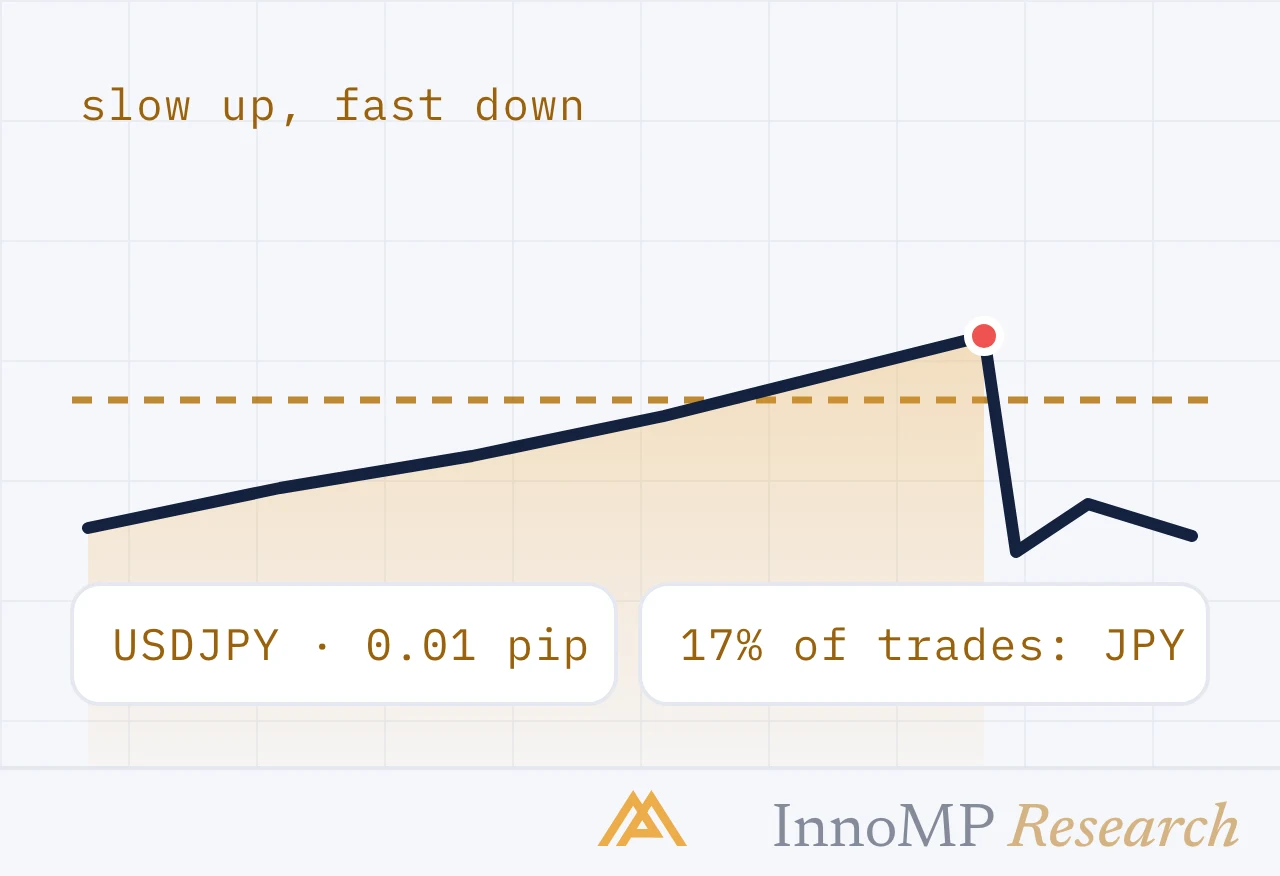
The yen is the third most traded currency, and the pair climbs slowly and falls fast. Rates, the carry trade, intervention, a moving pip value, and sizing.
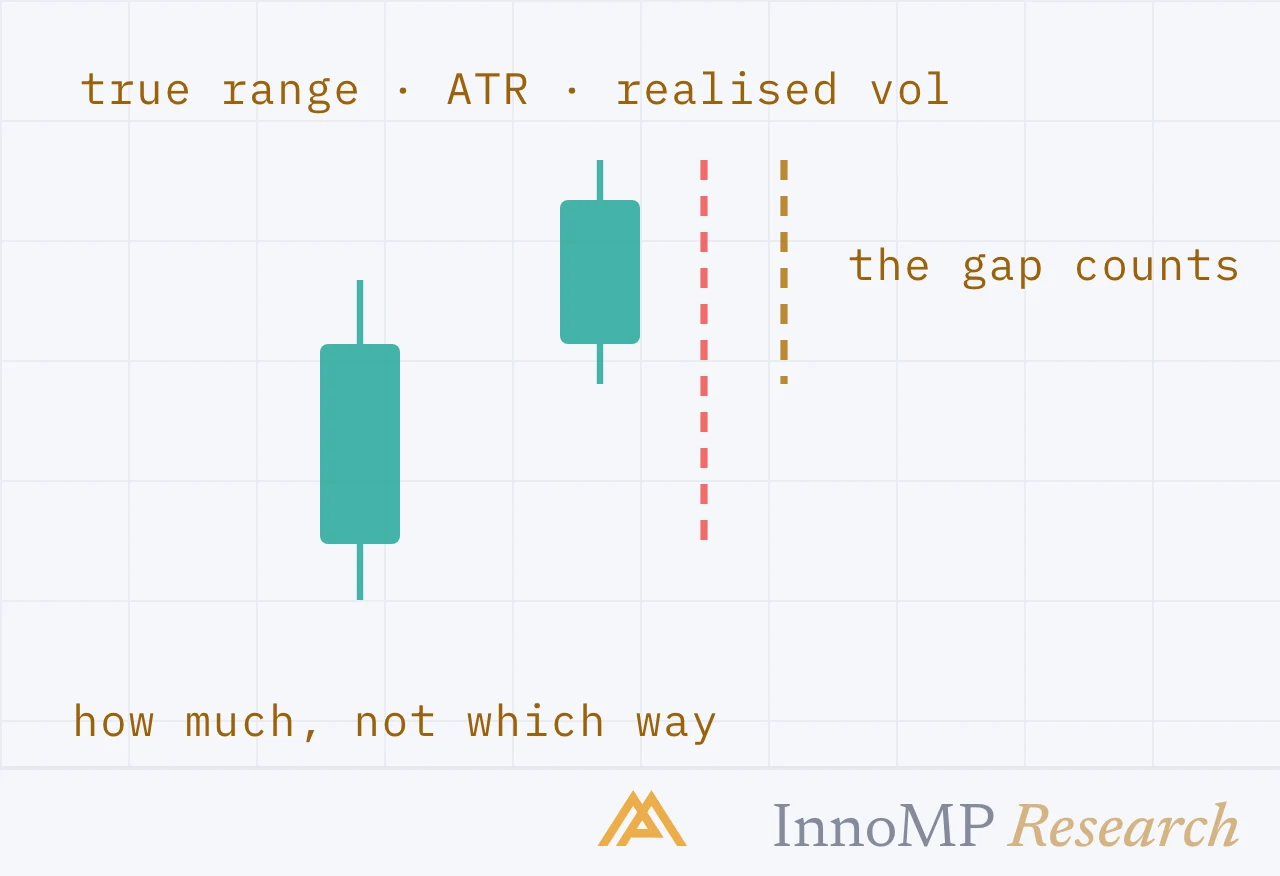
Volatility is how much price moves, not where. Three ways to measure it — the true range of a bar, its average over a window, and the standard deviation of returns — and what each one is for.
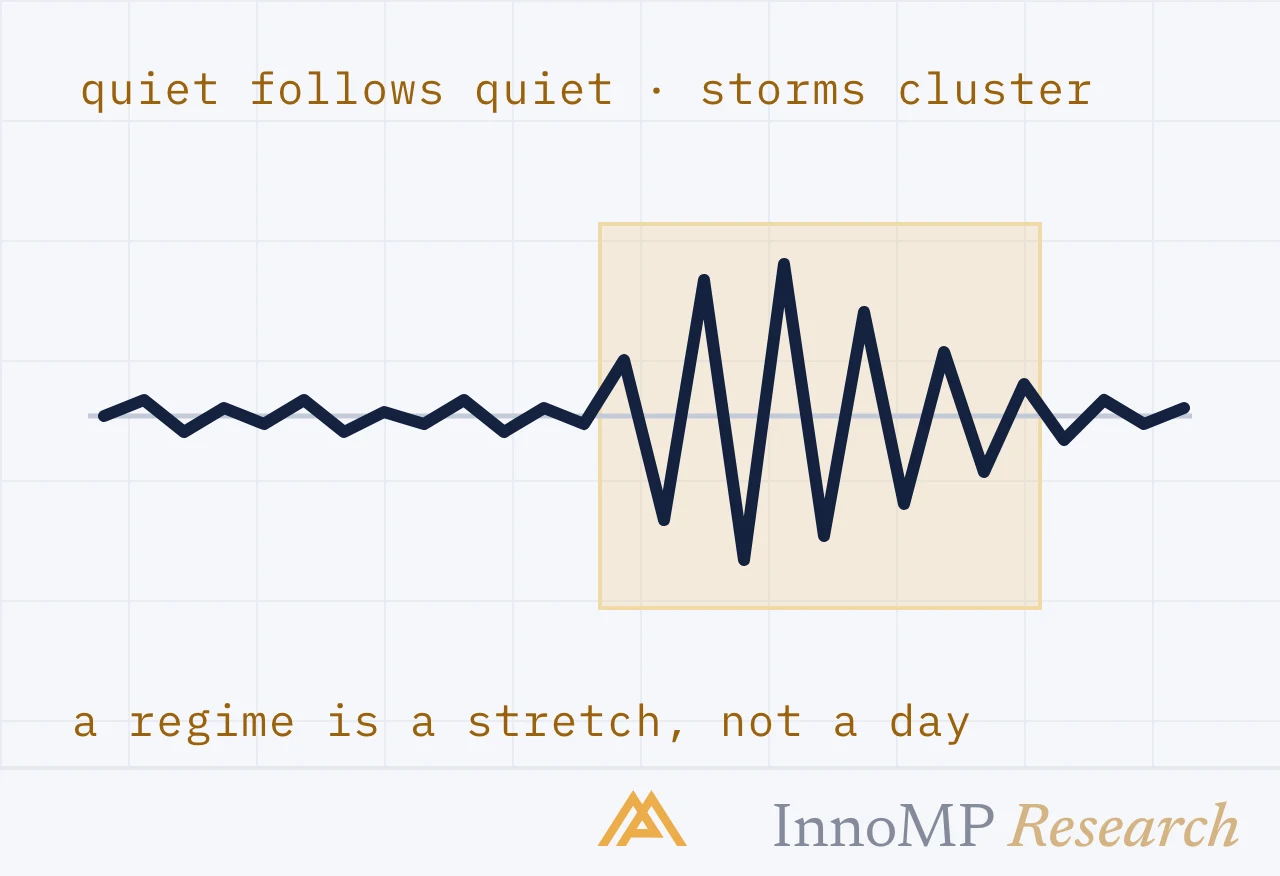
Volatility is not random day to day: large moves tend to follow large moves and small ones small. What a regime is, how to tell which one you are in, and why it changes every rule.
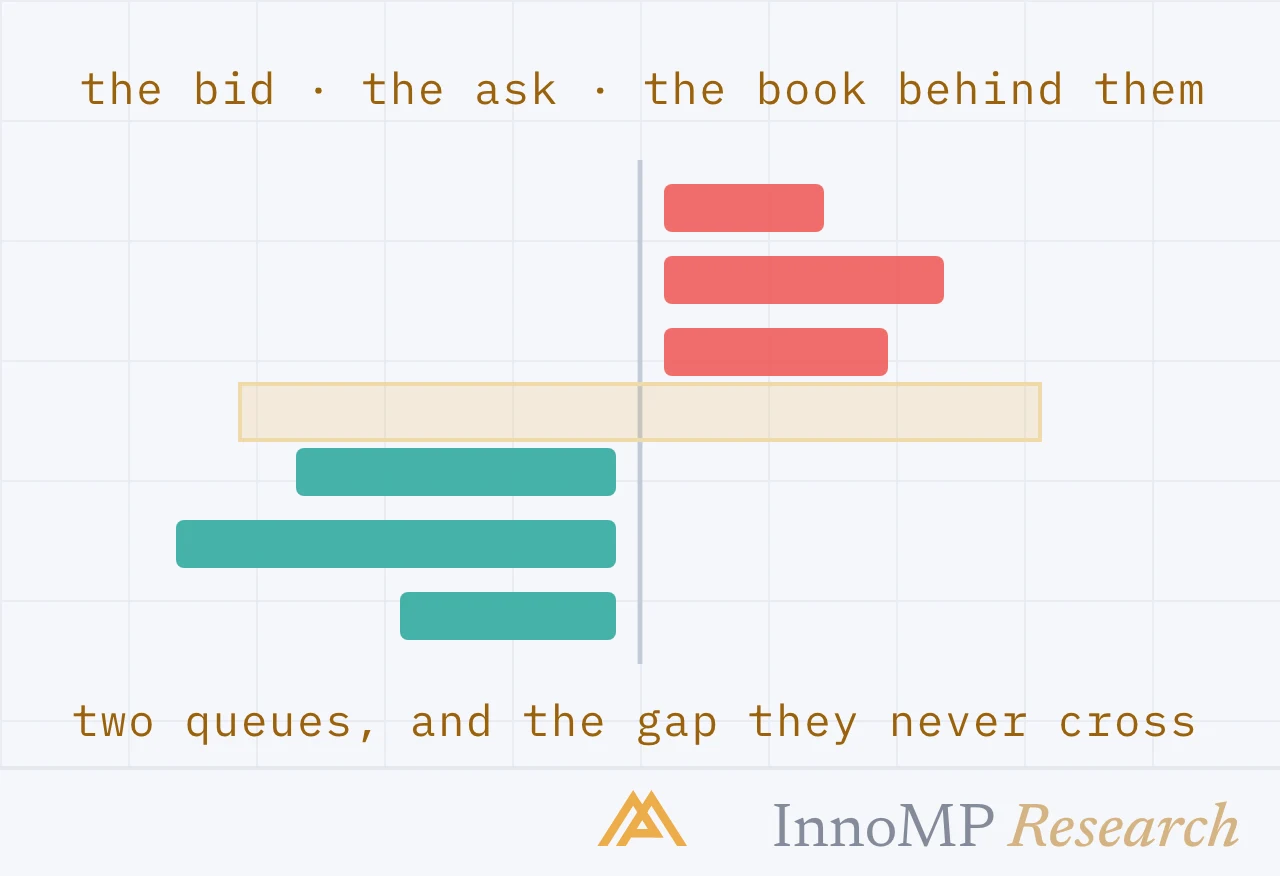
A quote is two prices, not one, and each is the front of a queue of orders. What the bid and ask are, why the spread exists, and what the book behind the quote decides about every fill.
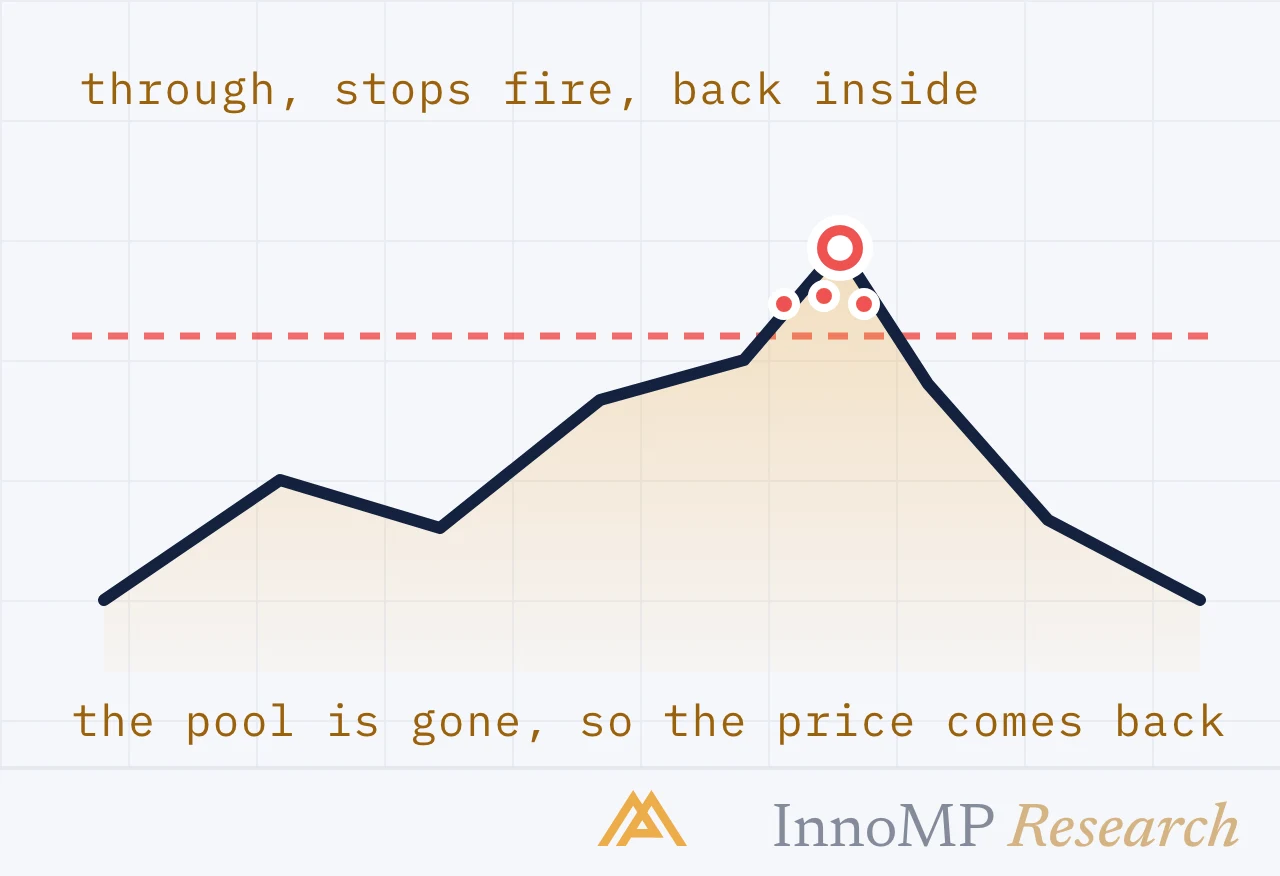
Price pushes through an obvious level, triggers the stops resting beyond it, and comes straight back. What a sweep is mechanically, why it happens where it does, and how to tell it from a break that is going to hold.
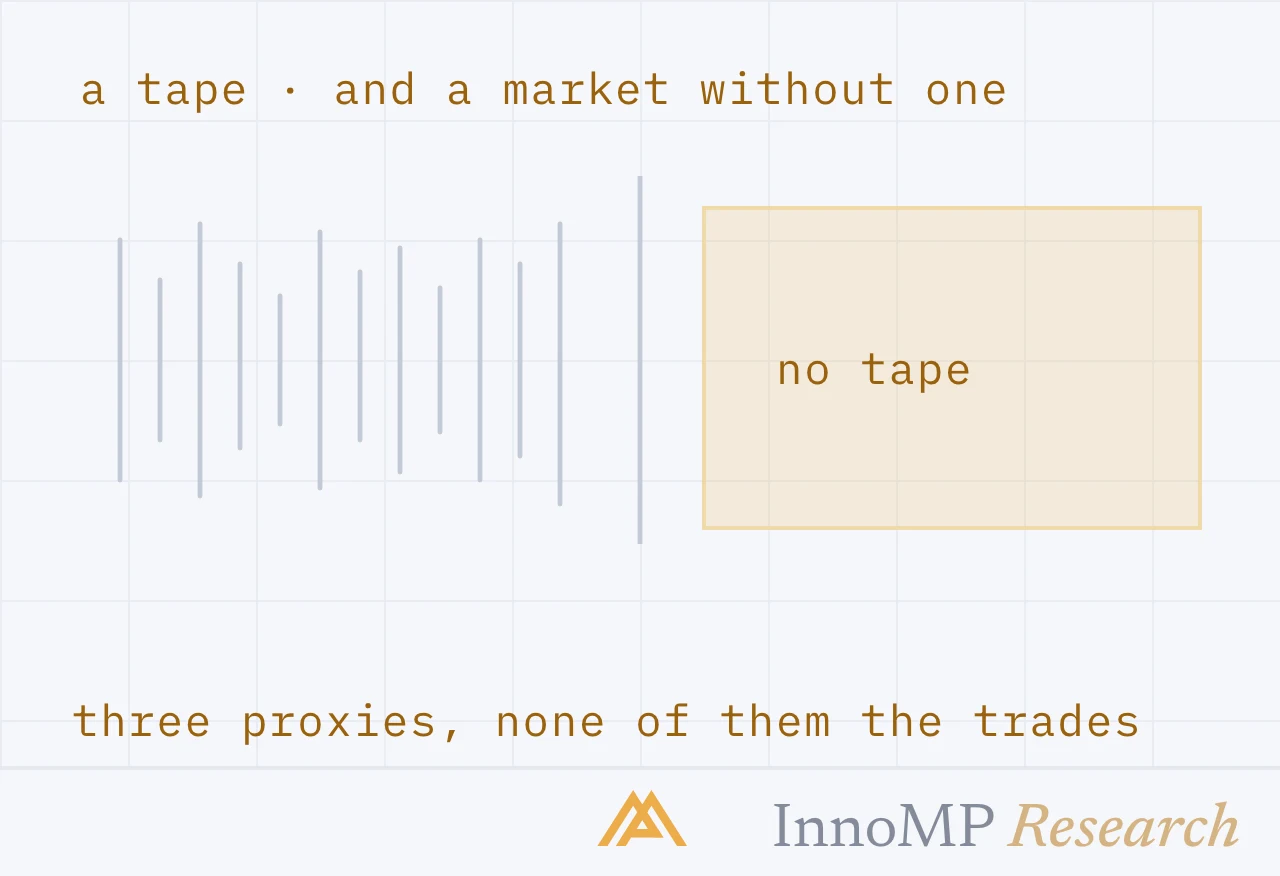
Order flow tools assume a tape: every trade, its size and side, in one place. Forex has no tape. What can stand in for it — tick volume, the broker's book, futures positioning — and where each one stops.
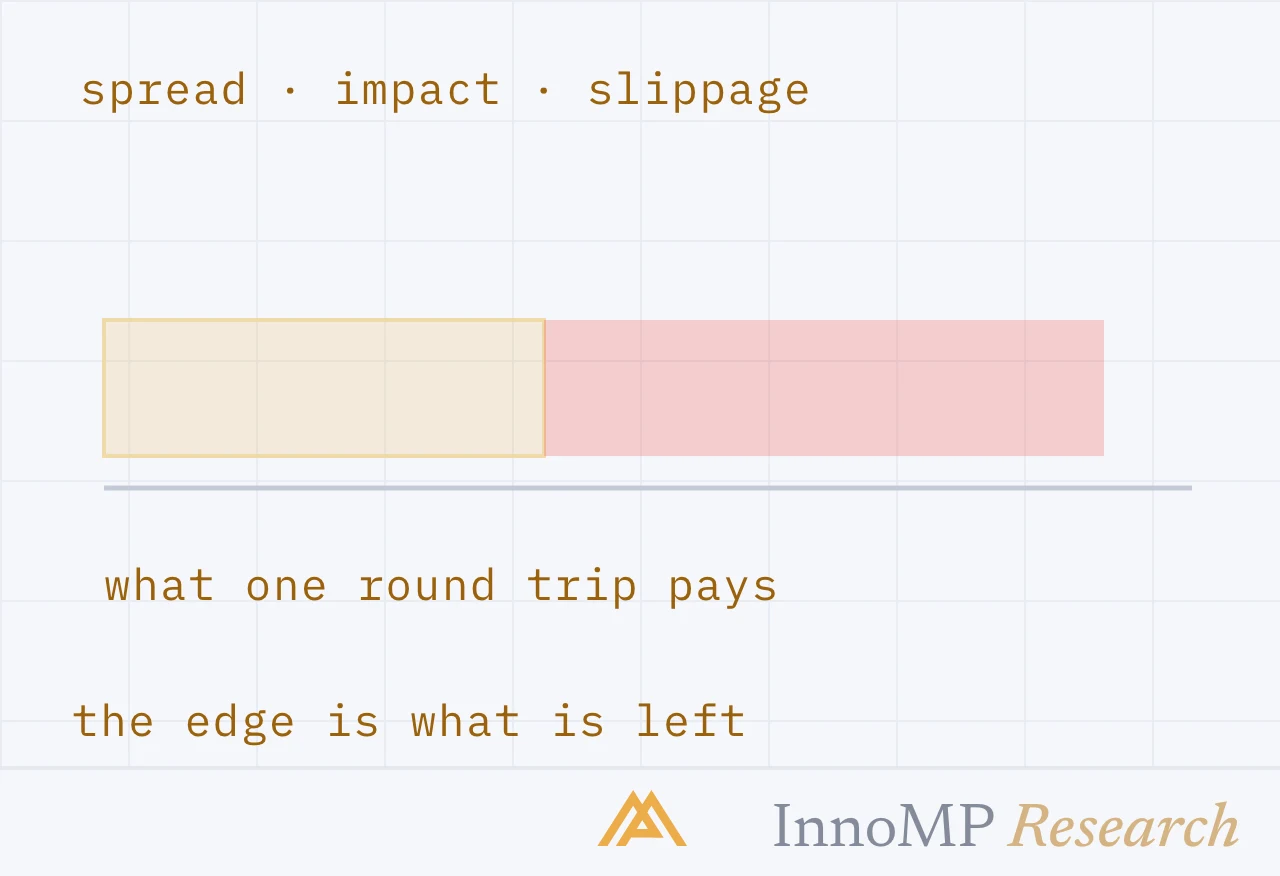
The spread is the visible cost. Depth decides whether that spread is available for your size, and slippage is the gap between the price you saw and the price you got. Why an edge is measured after all three.
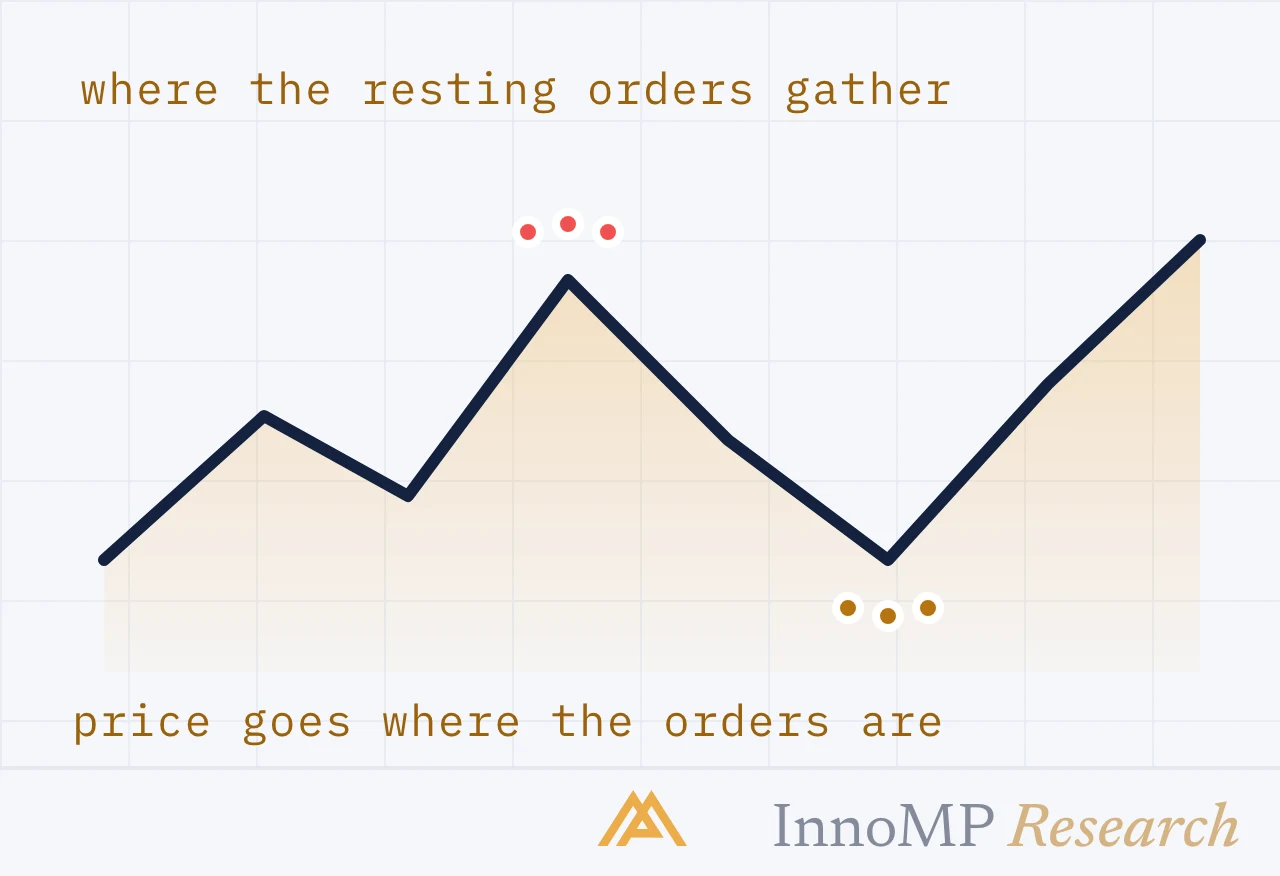
Liquidity is resting orders, and resting orders are not spread evenly. They gather beyond swing points, at round numbers and reference levels, and on the far side of obvious lines. Why price is drawn to those places.
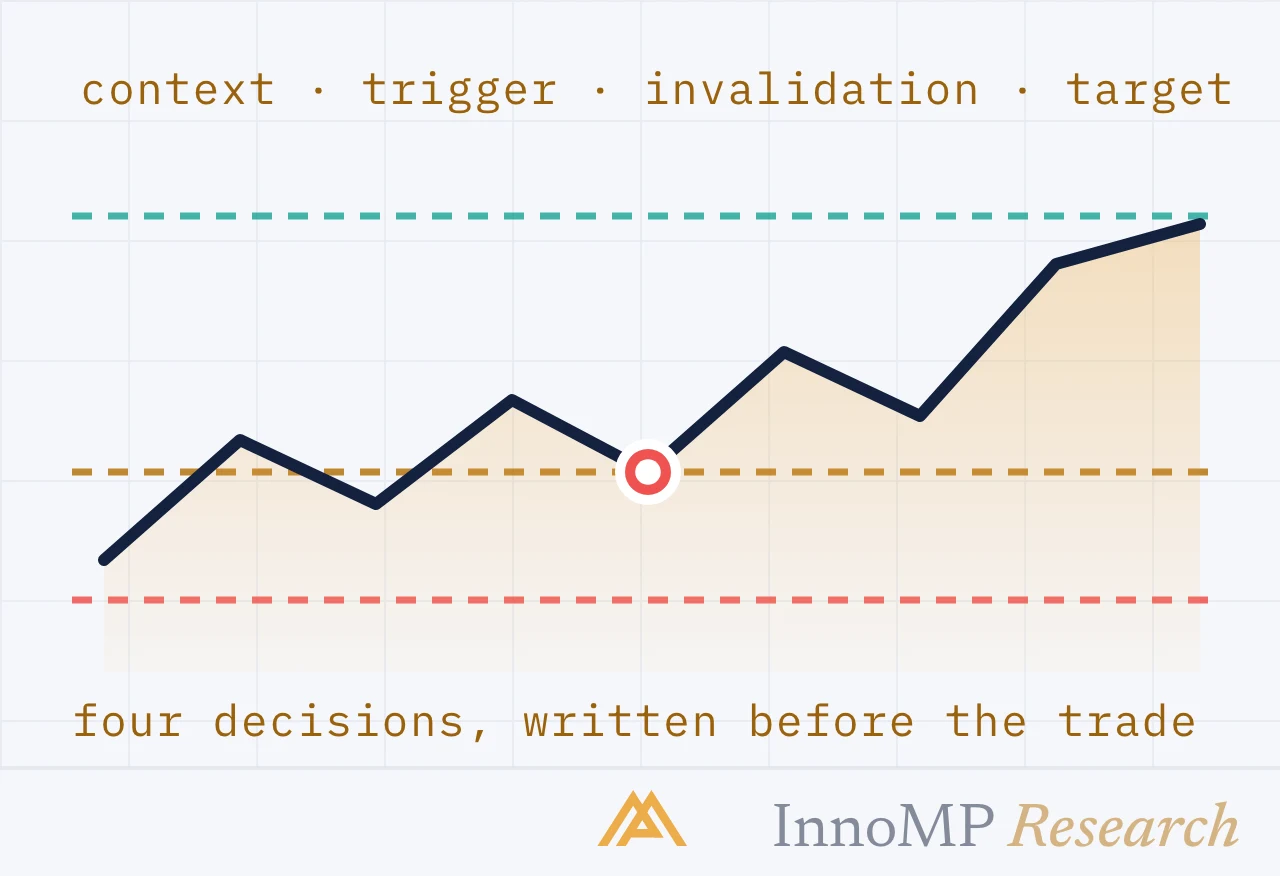
A setup is not a pattern. It is four decisions written before the trade: the context that makes it worth watching, the trigger that makes it a trade, the price that proves it wrong, and the price it aims at.
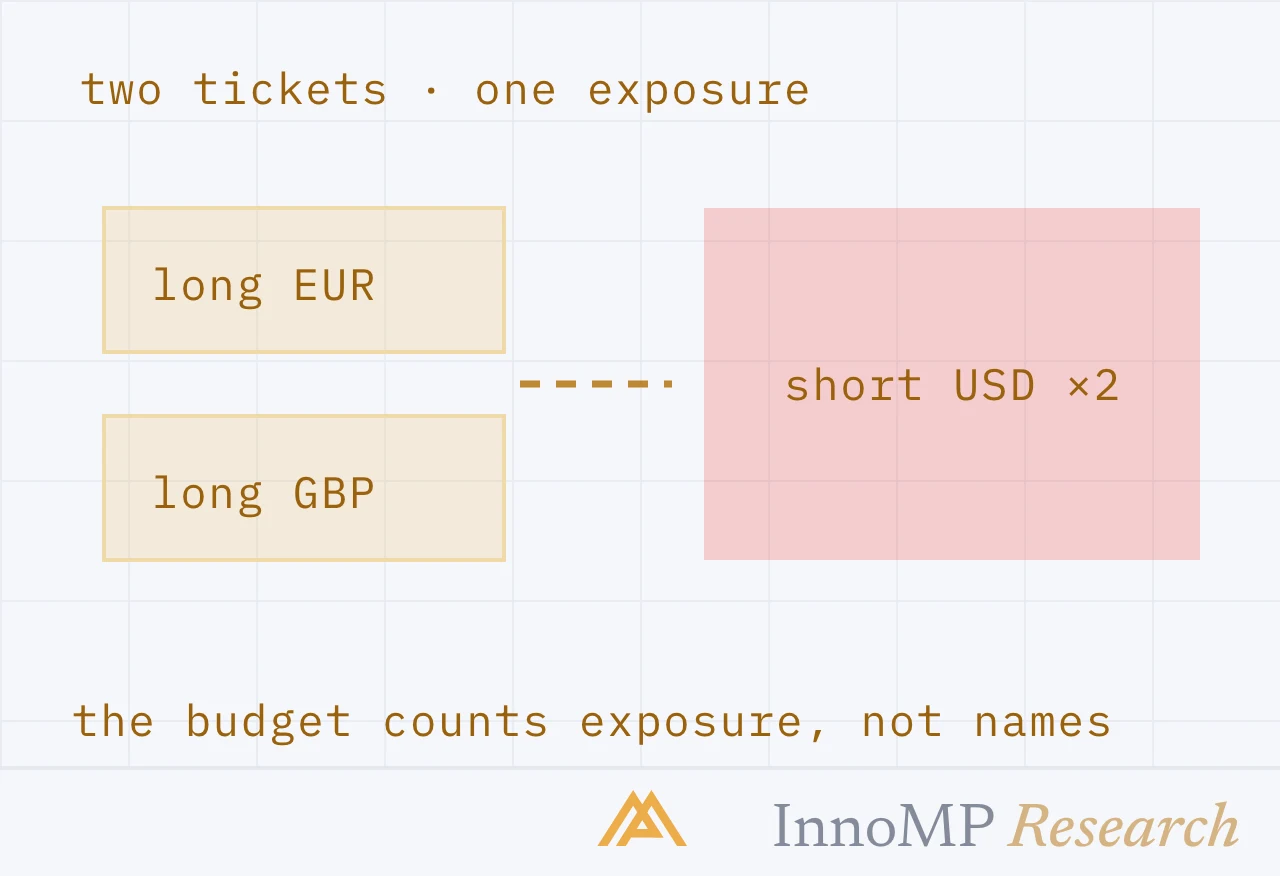
Long EURUSD and long GBPUSD is not two trades. It is one short-dollar position with two names, and the risk budget has to see it that way. How exposure adds up across pairs that share a leg, and how to size for it.
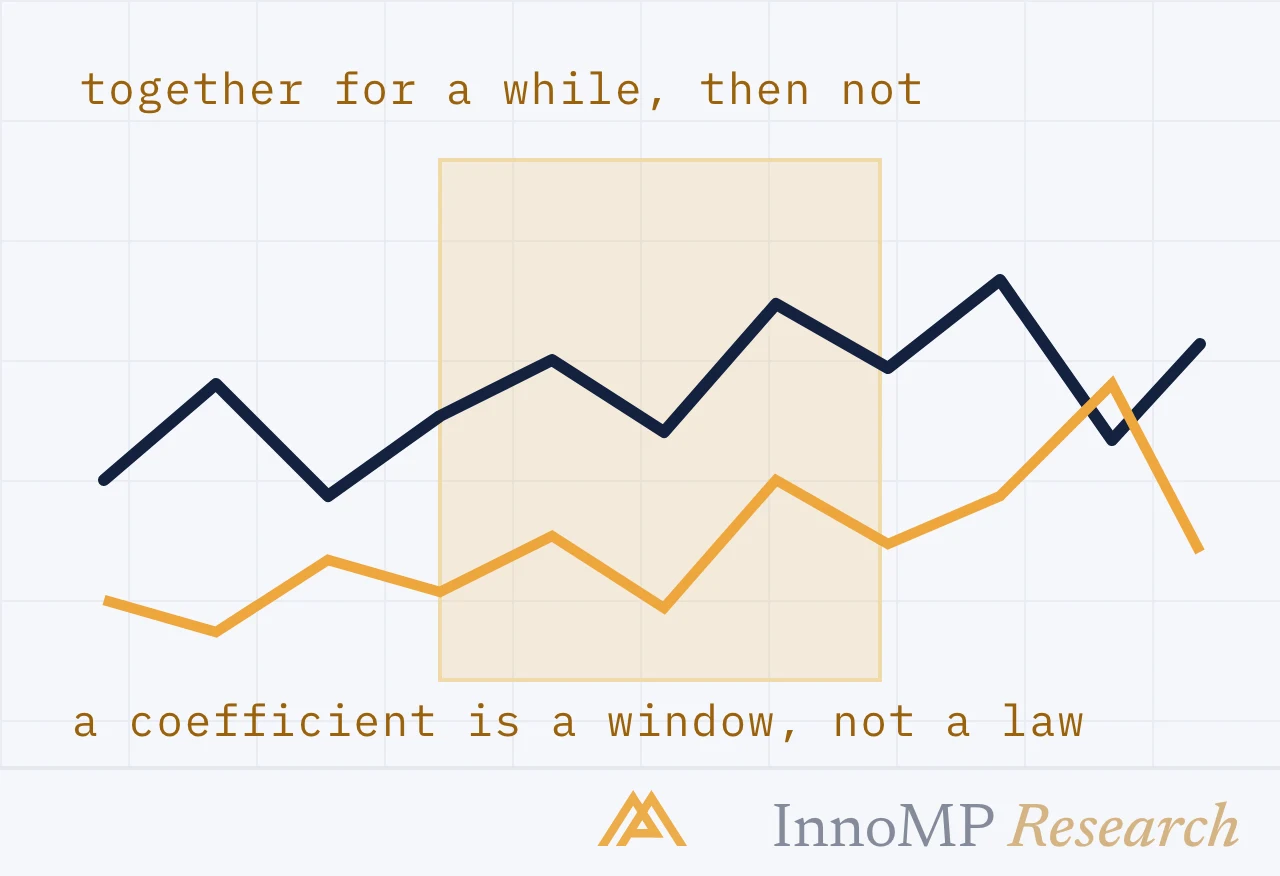
Some markets move together, some move opposite, and most of those relationships are temporary. What the correlation coefficient measures, why the number changes, and how to use it without mistaking a pattern for a law.
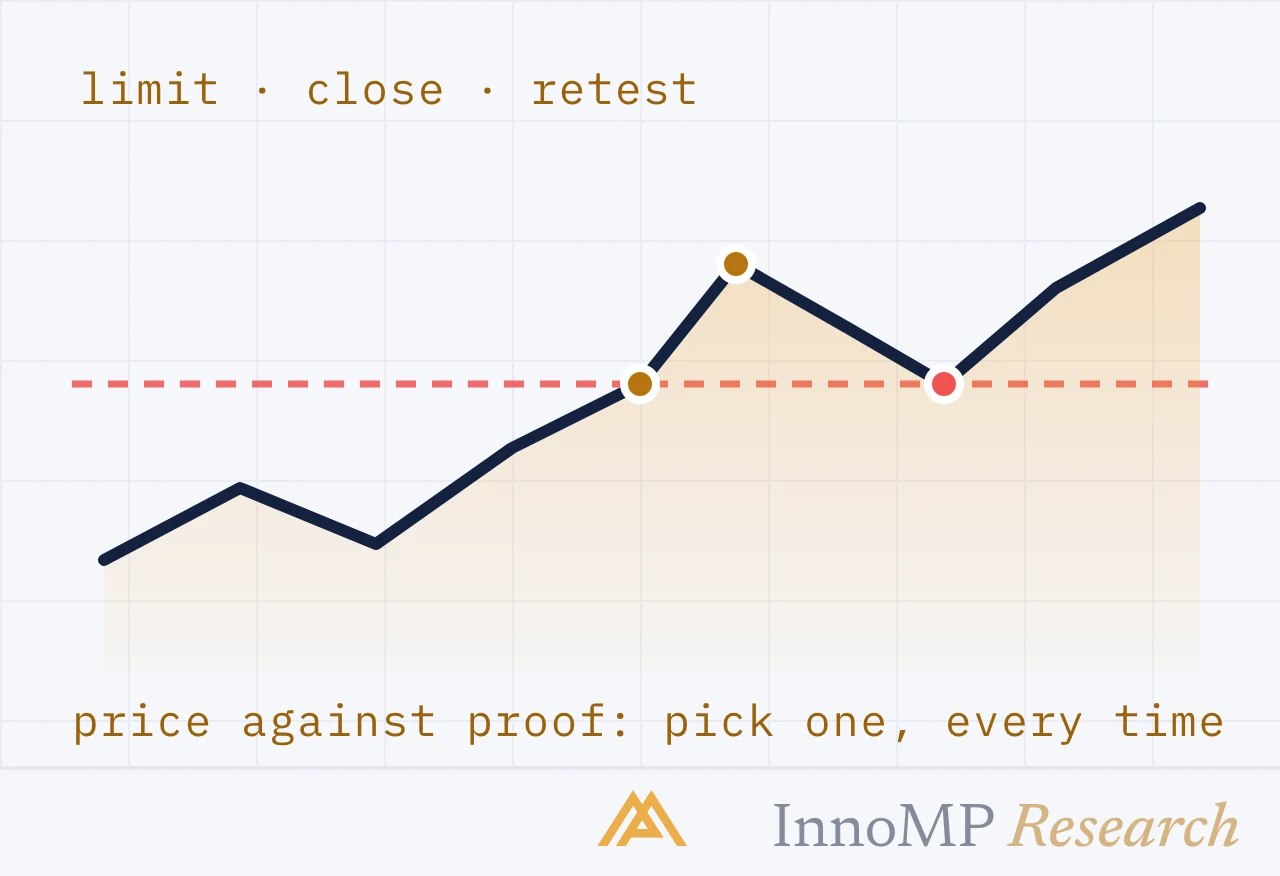
Every entry trades price against evidence. Enter early and the stop is tight but the setup is unproven; wait for confirmation and it is proven but the price is worse. The three common triggers, priced against each other.
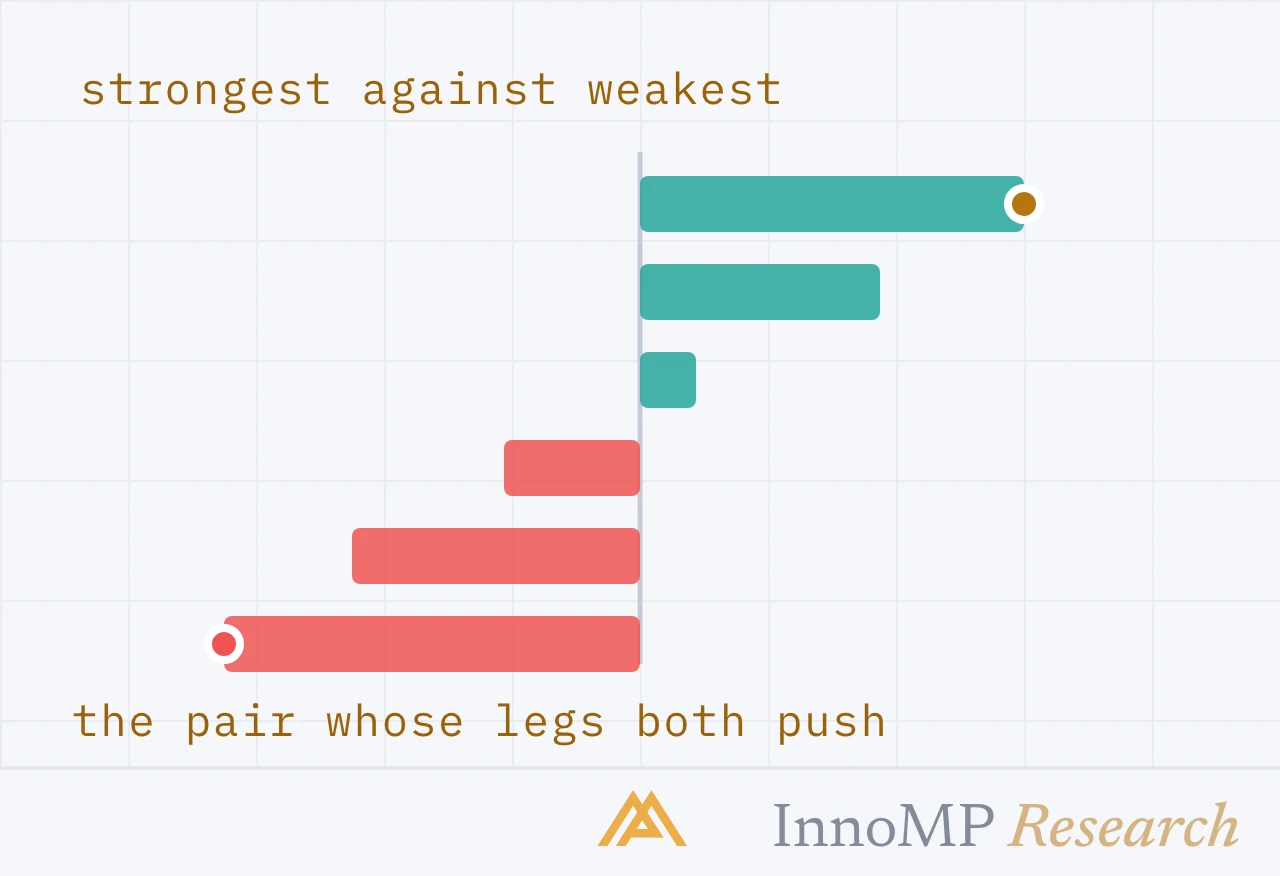
A pair is two currencies. When the euro is the strongest major and the dollar the weakest, EURUSD moves further than either leg alone. How to rank currencies, and why strongest against weakest trends cleanest.
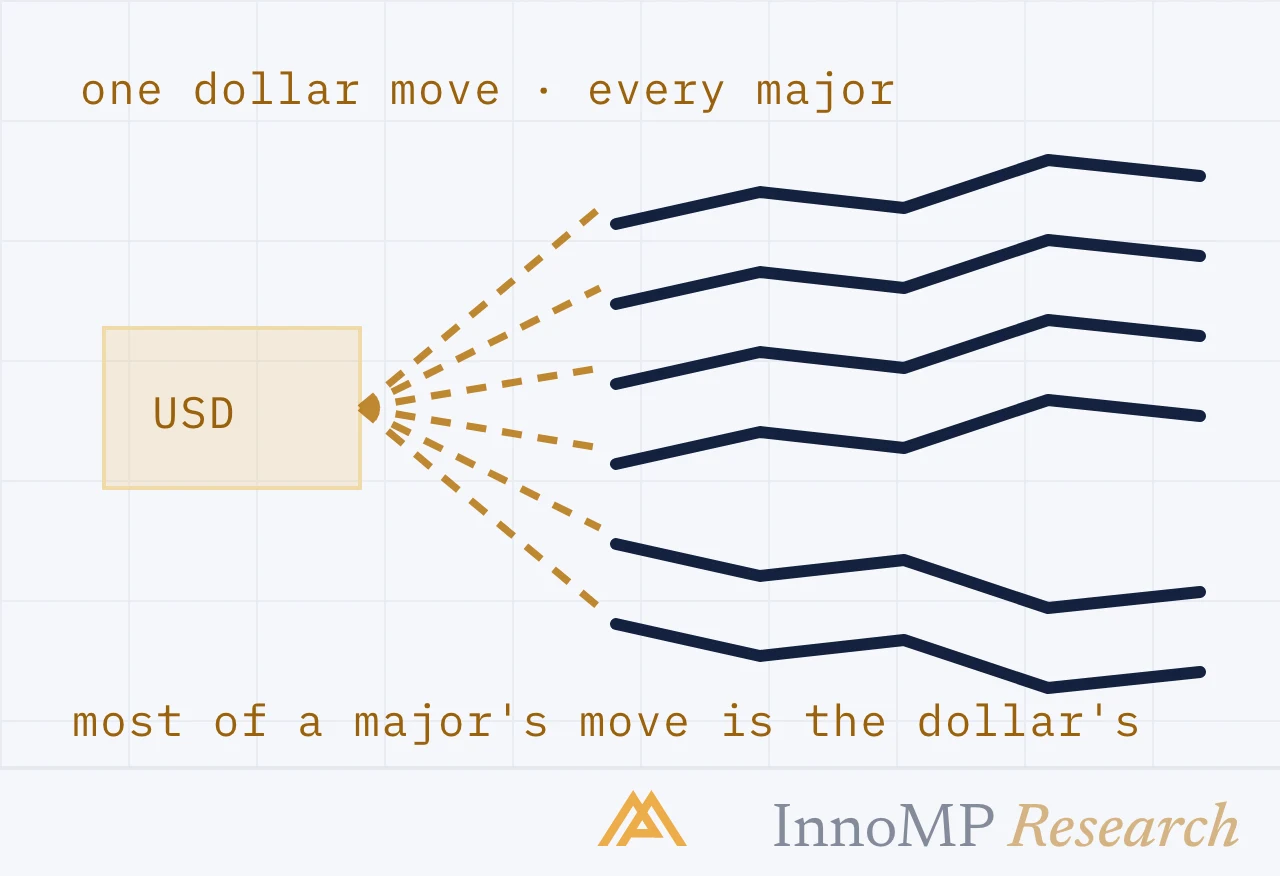
The dollar is on one side of 88% of all FX trades, and every major pair has it as a leg. Most of what a major does is the dollar doing it. What the dollar index measures, and how to tell a euro move from a dollar move.
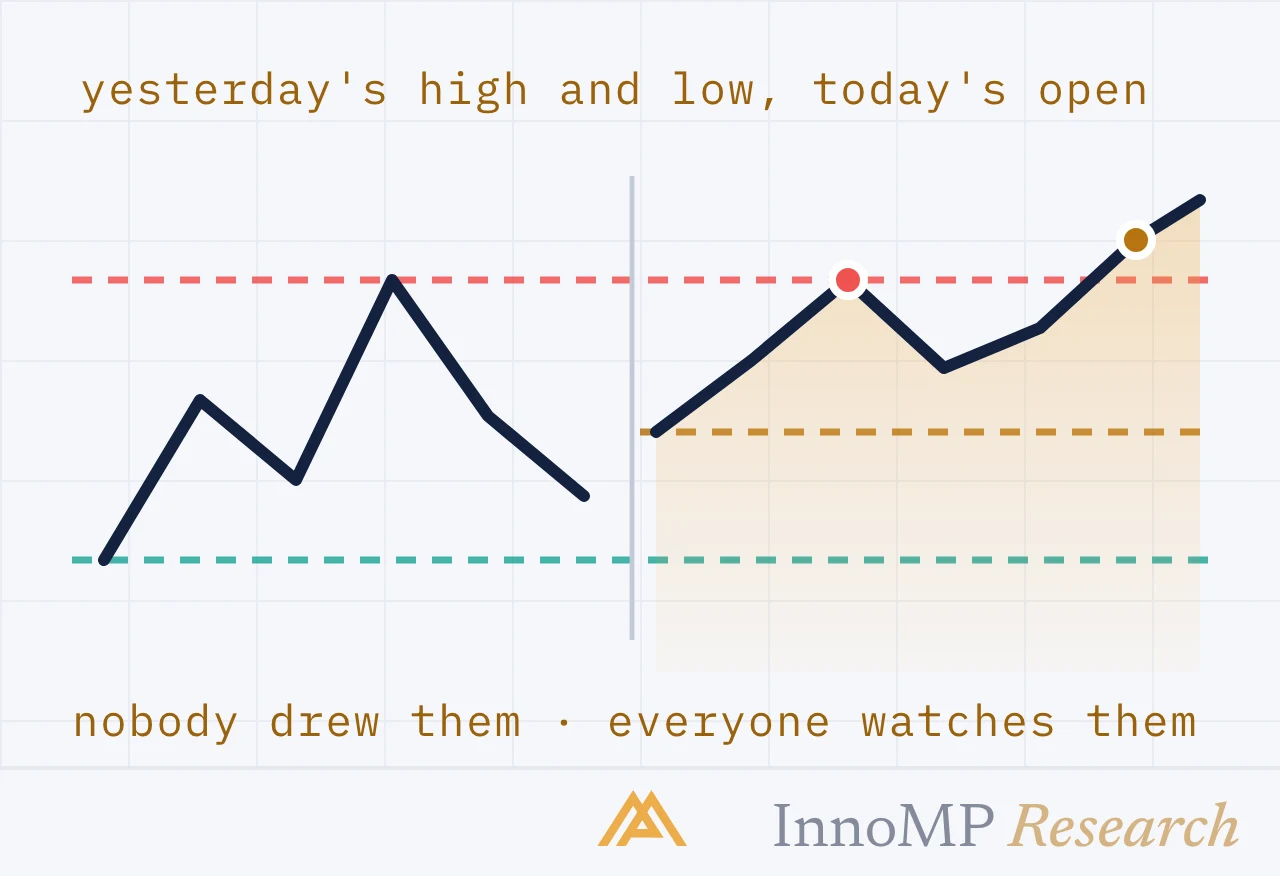
Every day leaves levels behind that thousands of screens watch: the previous day's high and low, the daily and weekly open, each session's extremes. Why they behave like support and resistance, and how to rank them.
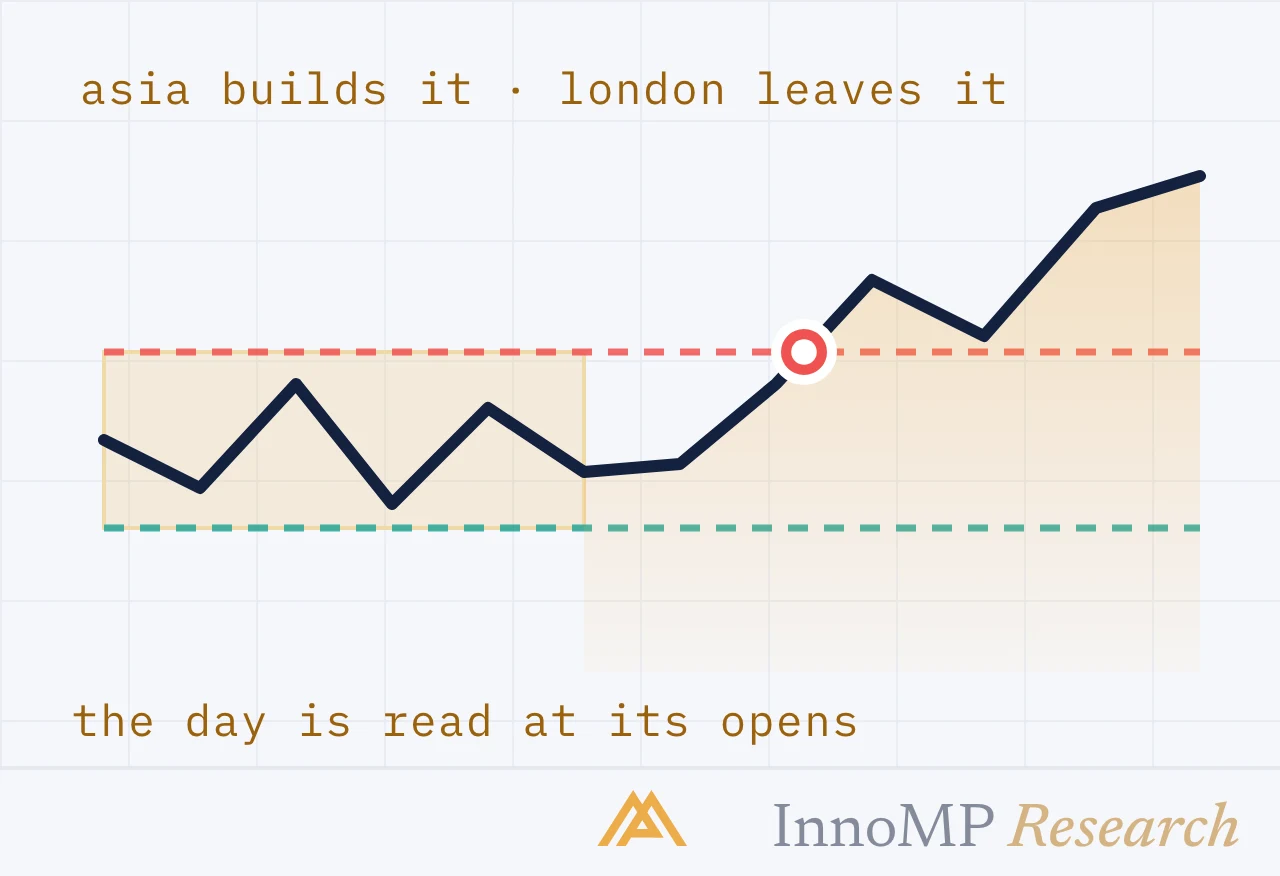
A forex day is not 24 equal hours. Asia builds a range, London decides which side of it to leave, New York extends that or reverses it. How to read each open as an event, and what the Asian range is worth.
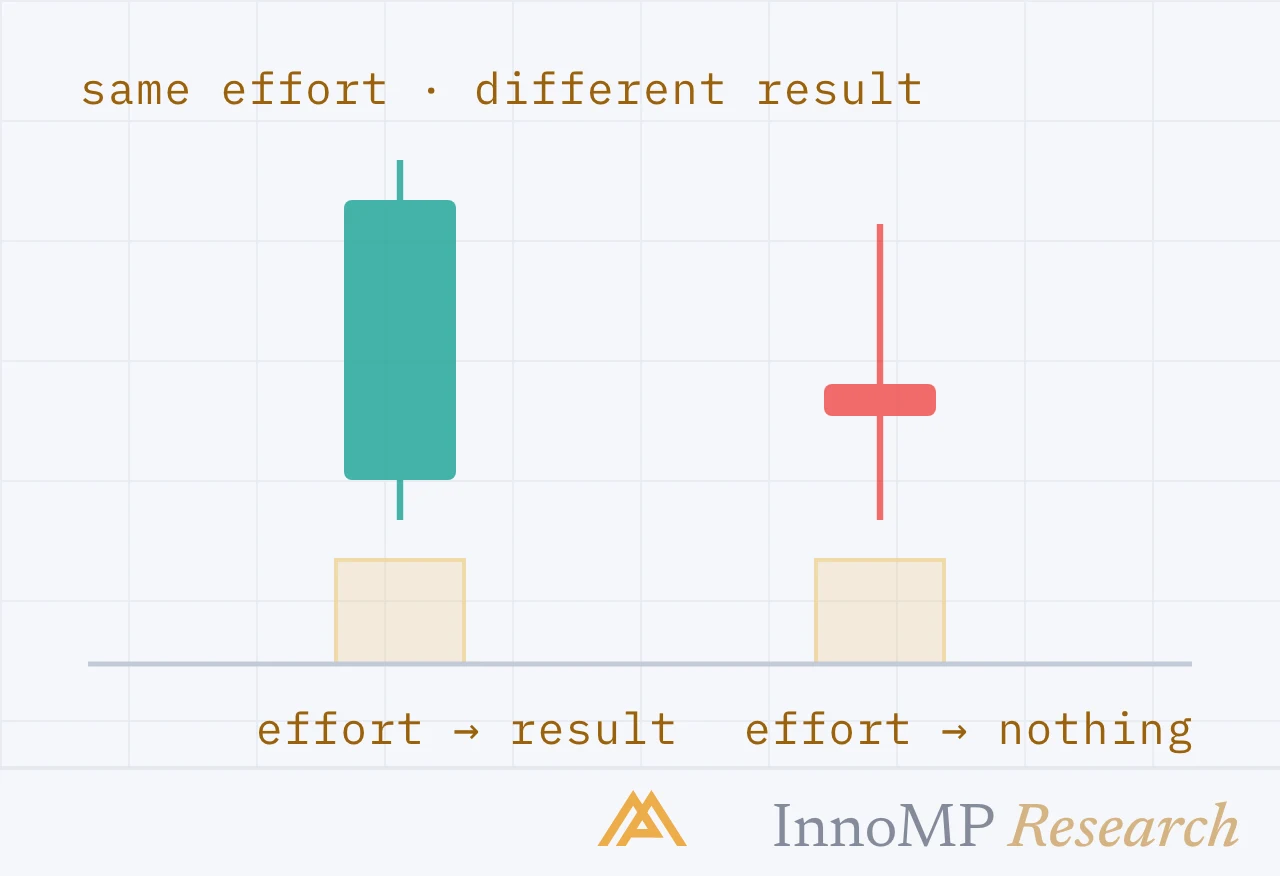
Volume is the effort; the price change it produced is the result. When they disagree — a busy candle that goes nowhere, a quiet one that goes far — the chart says something price alone cannot. The four combinations.
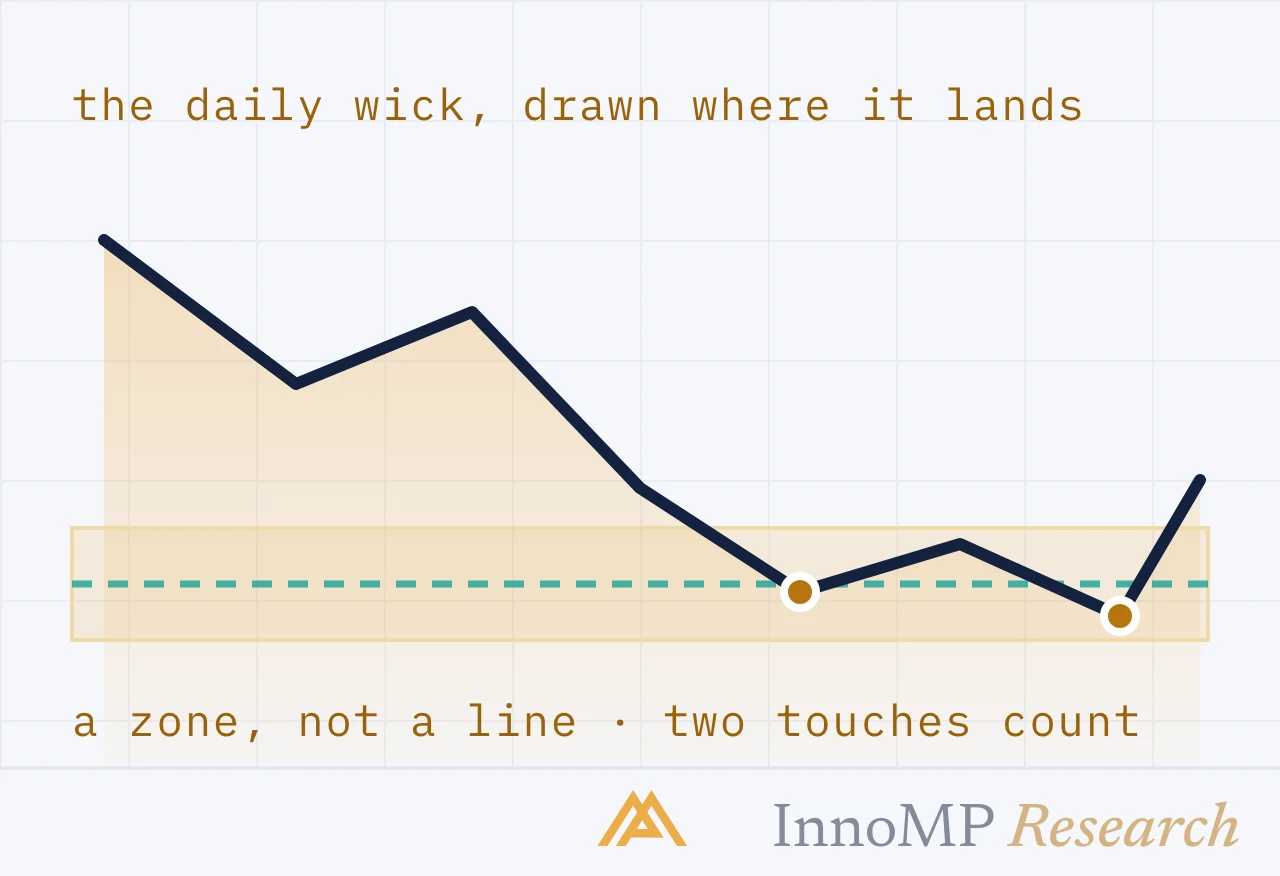
Which levels from the daily chart deserve a place on the chart you trade, why they become zones rather than lines when they get there, and what a real reaction at one looks like.
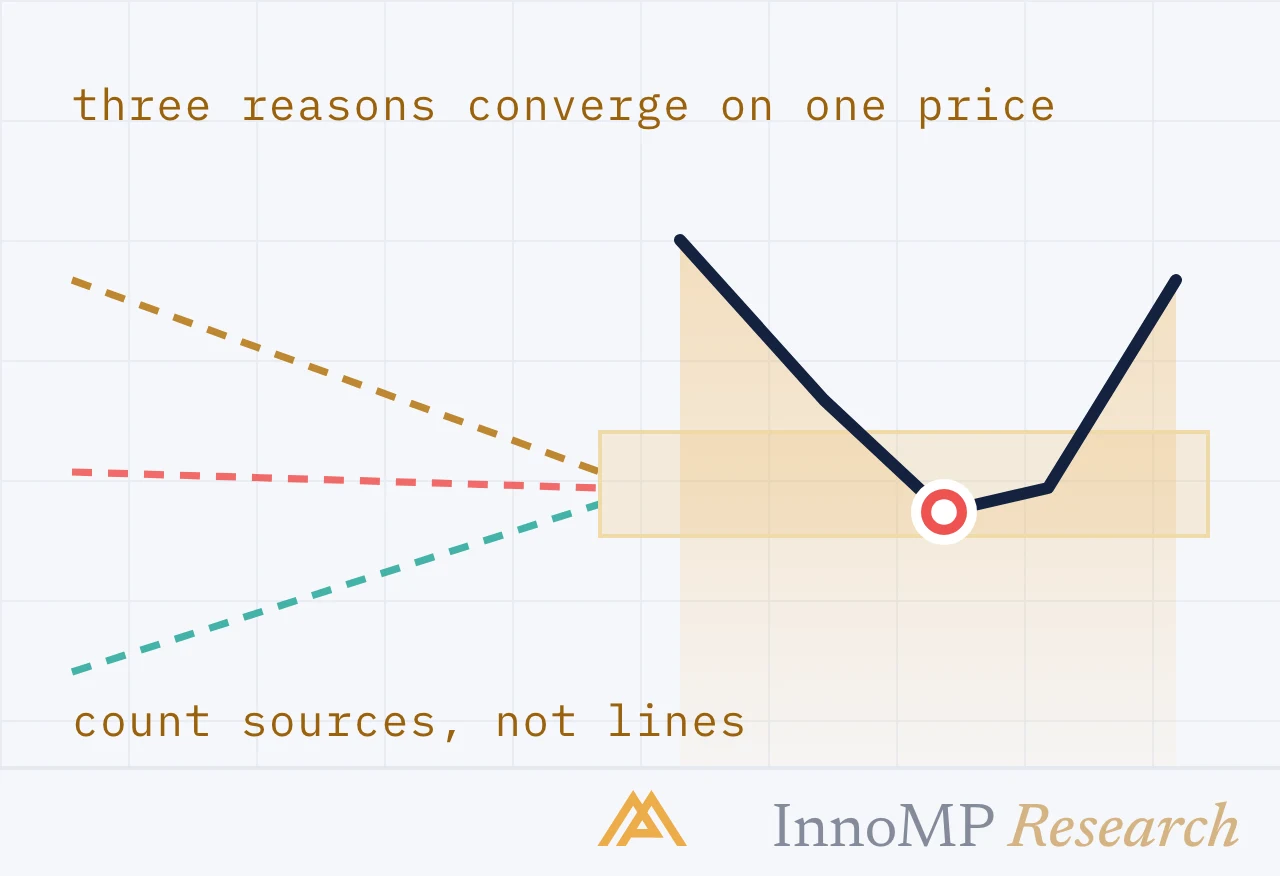
When the daily, the 4-hour and the 1-hour point the same way a trade has more behind it — if the reasons are independent. How to count confluence honestly, and why two indicators on one chart are one reason.
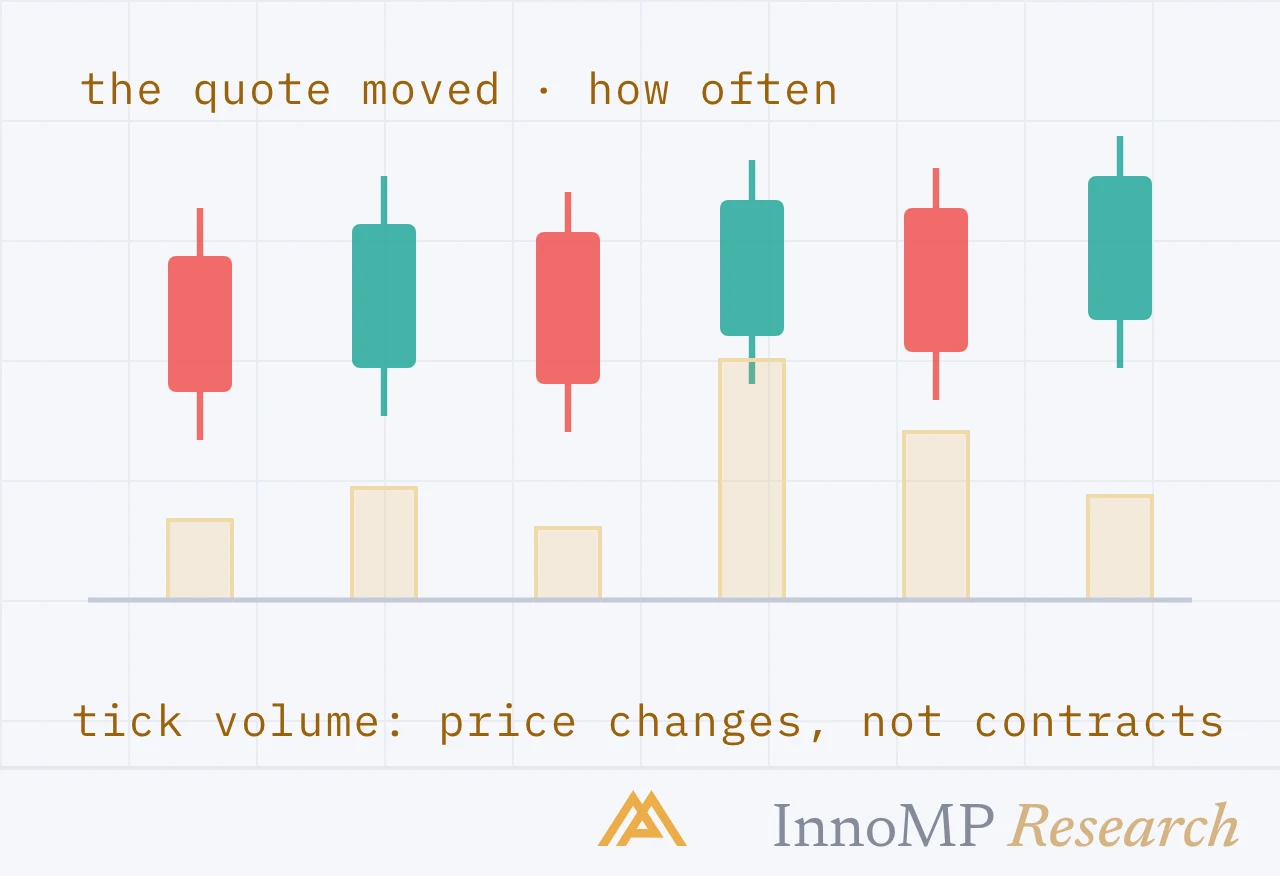
Forex has no central exchange, so the volume under a currency chart counts price changes, not contracts. What tick volume can still tell you, how to read it against the session, and where it misleads.
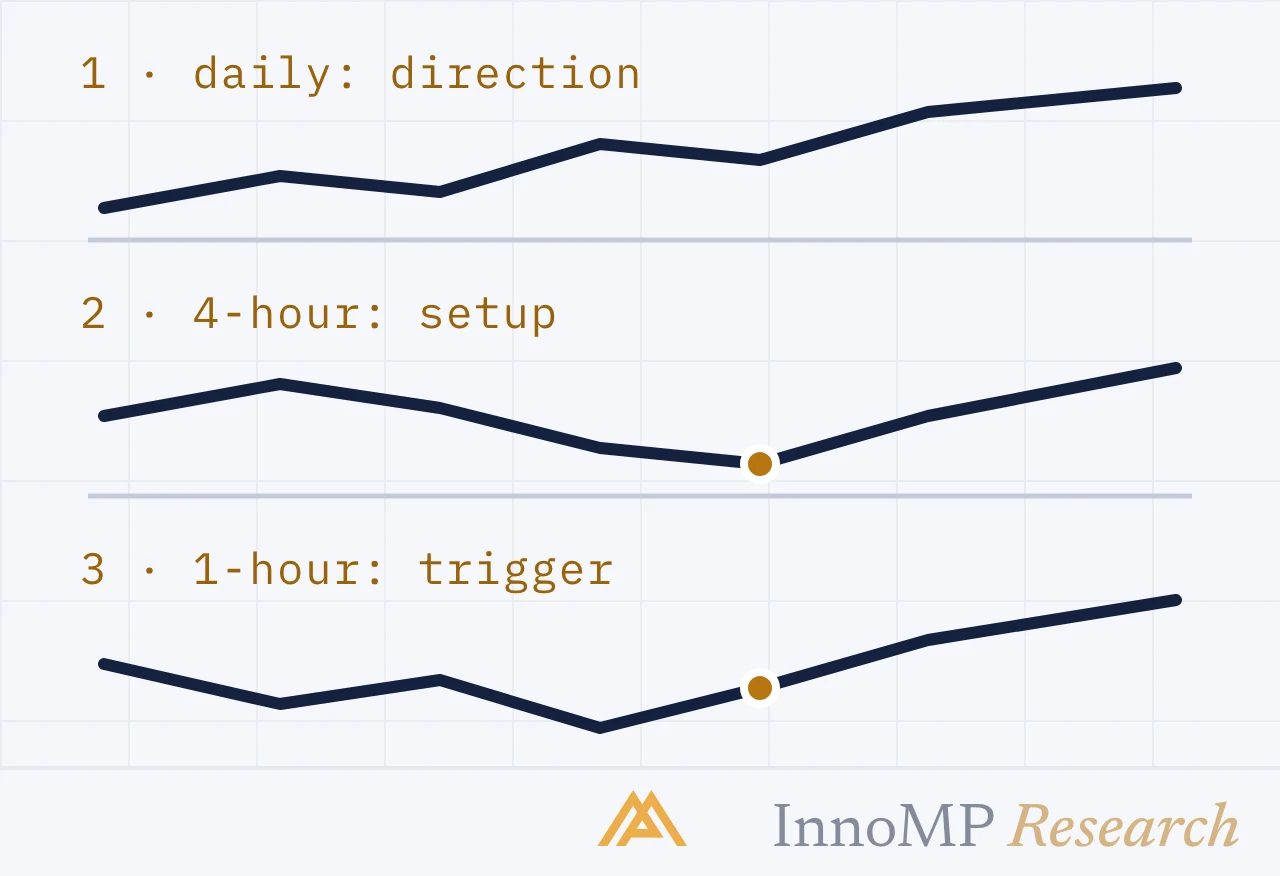
Direction from the higher chart, the setup on the trading chart, the trigger from the lower one — and why the order is the whole method. Level 2 of the technical analysis course starts here.
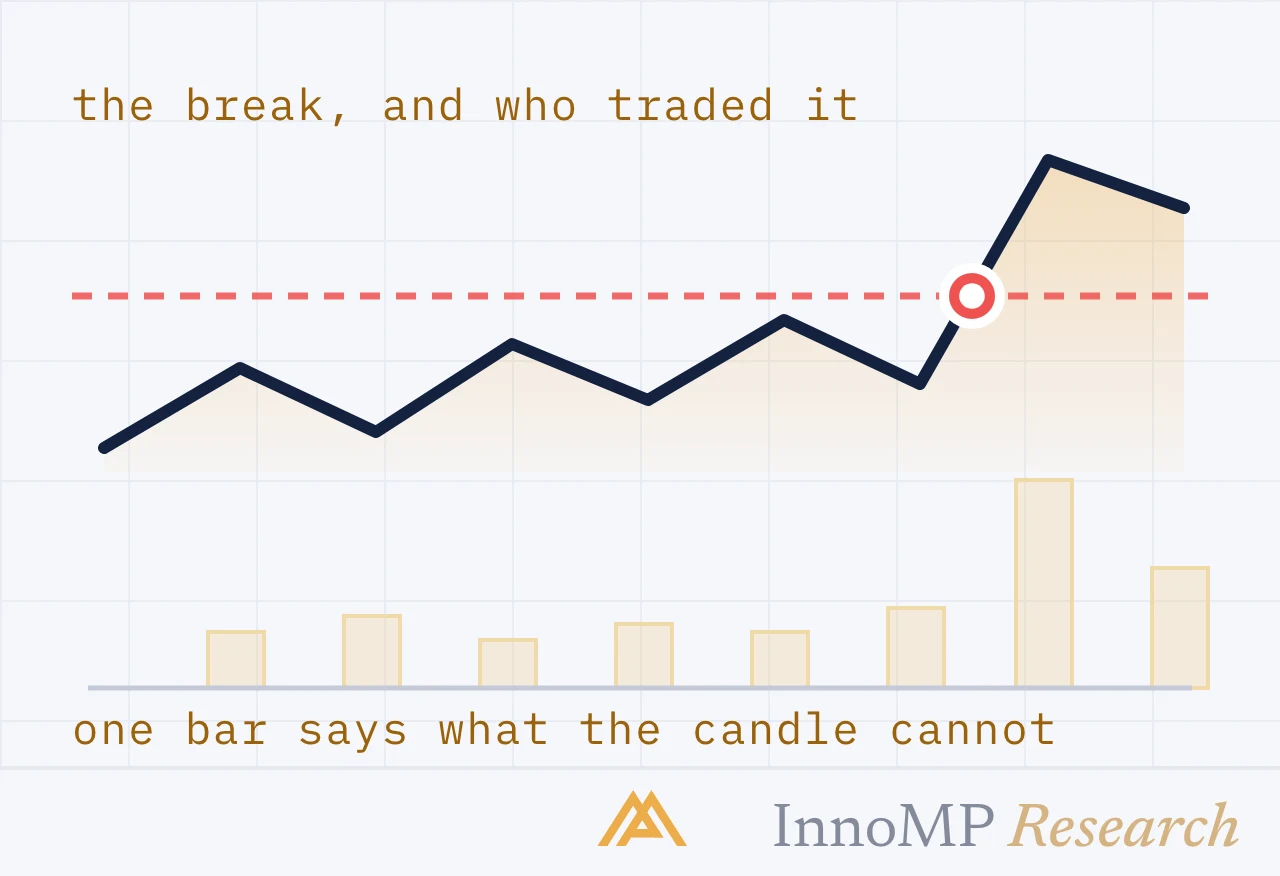
The two moments participation matters most: when price leaves a range, and when a move runs out. How to read tick volume at the break, at the retest and at the end of a trend — against the right baseline.
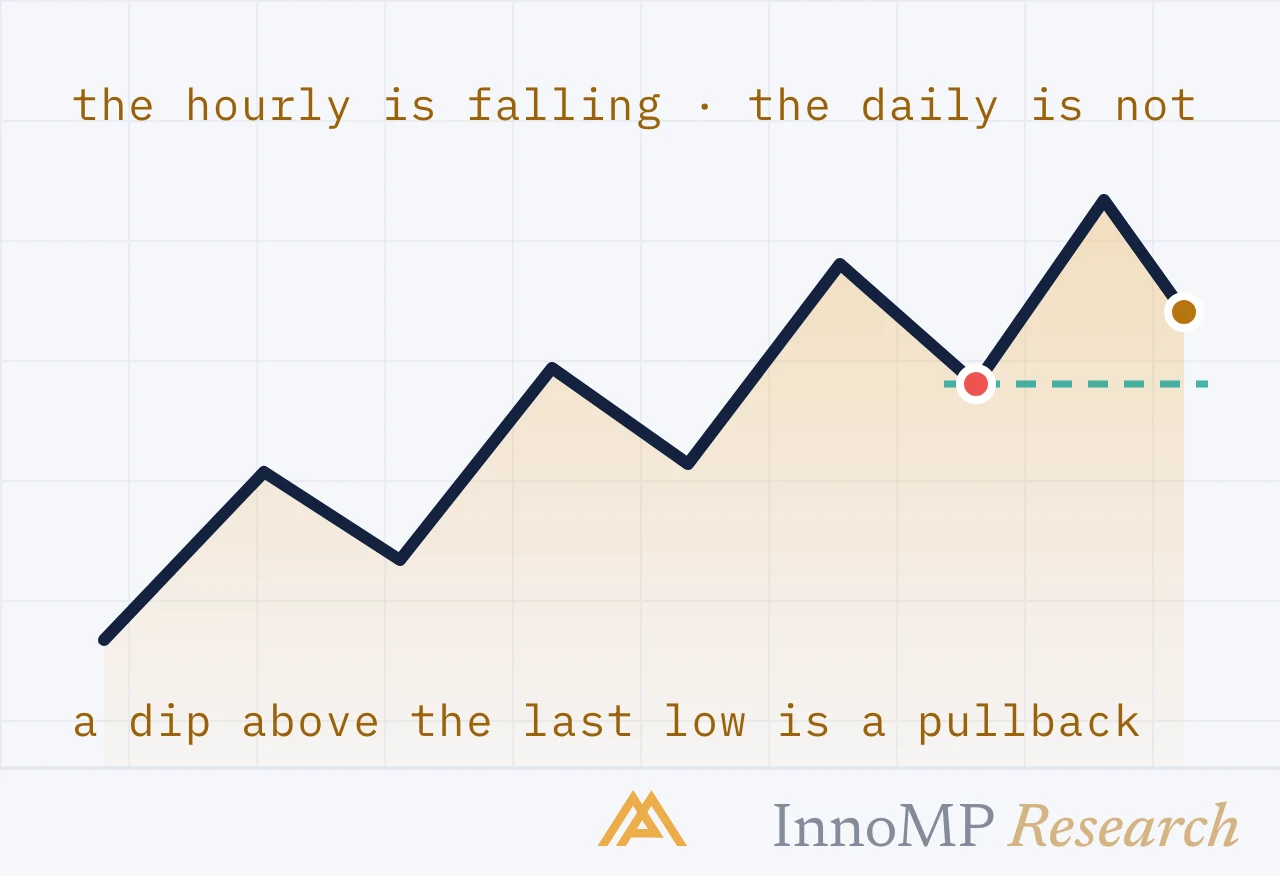
The lower chart is falling while the higher one is rising. Most of the time that is a pullback — the setup you were waiting for. Occasionally it is the higher trend ending. How to tell which, with the structure test.
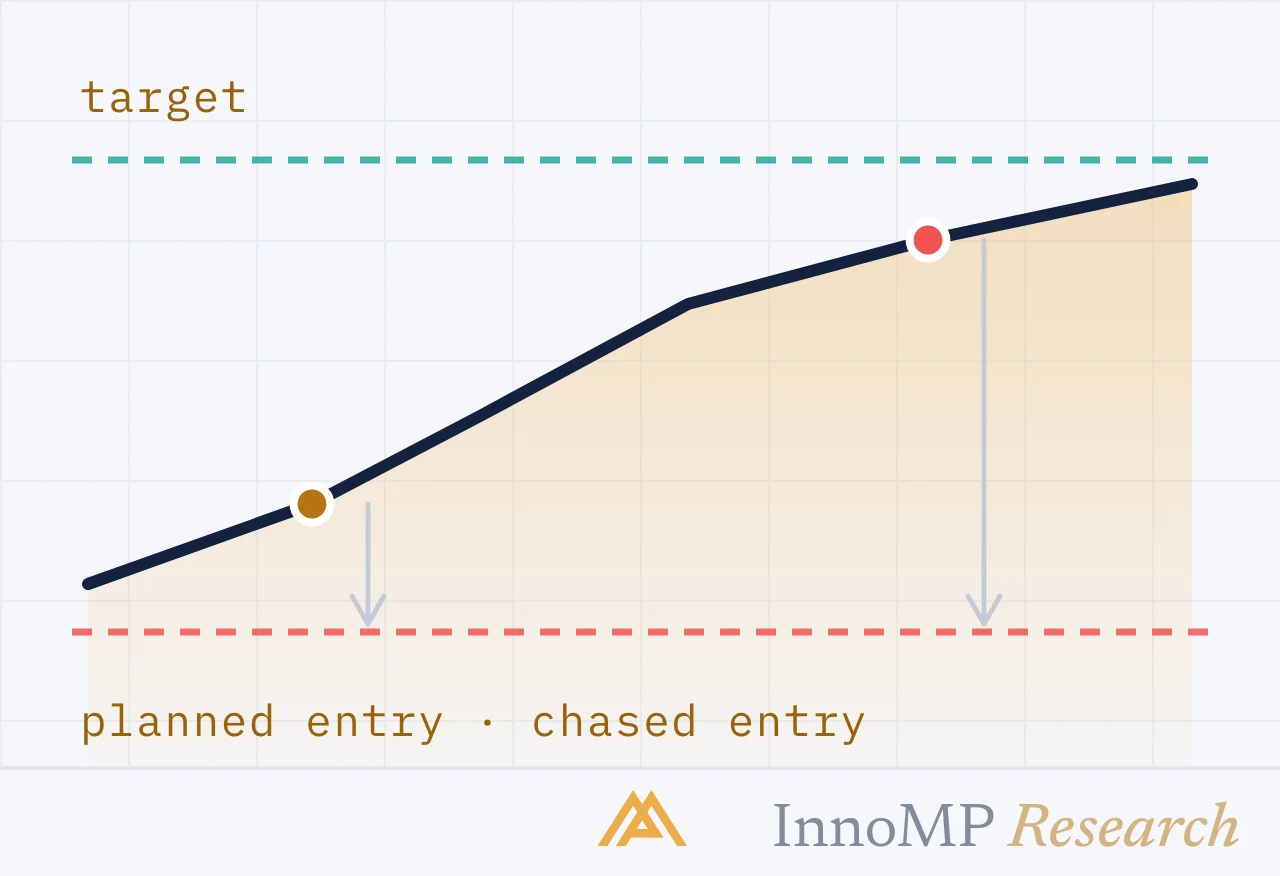
The setup came and went without you. Then price runs, and entering late feels urgent. Why chased entries carry the worst risk-reward on the chart.
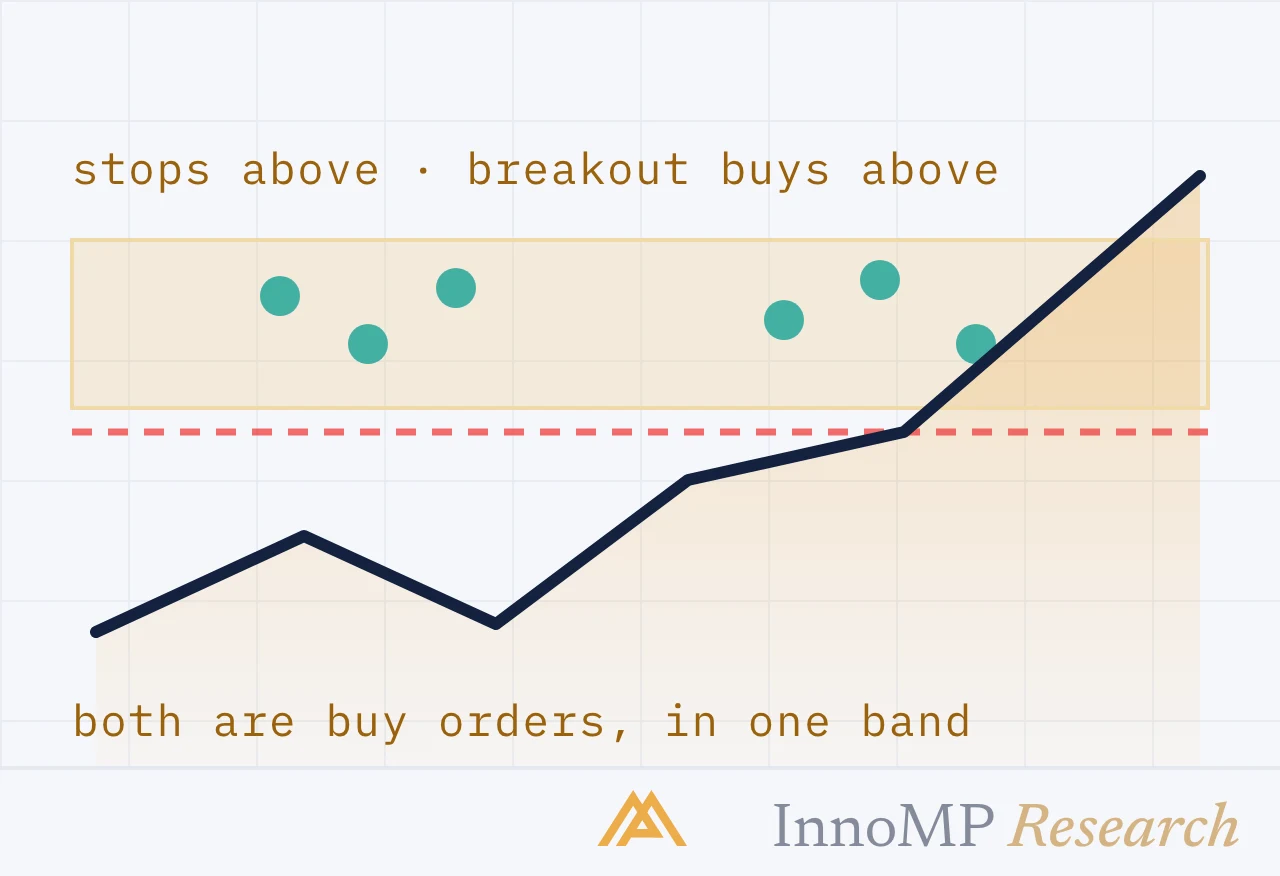
The break of a level is the most-watched event on any chart and the least reliable. What separates a break that holds from one that traps you.
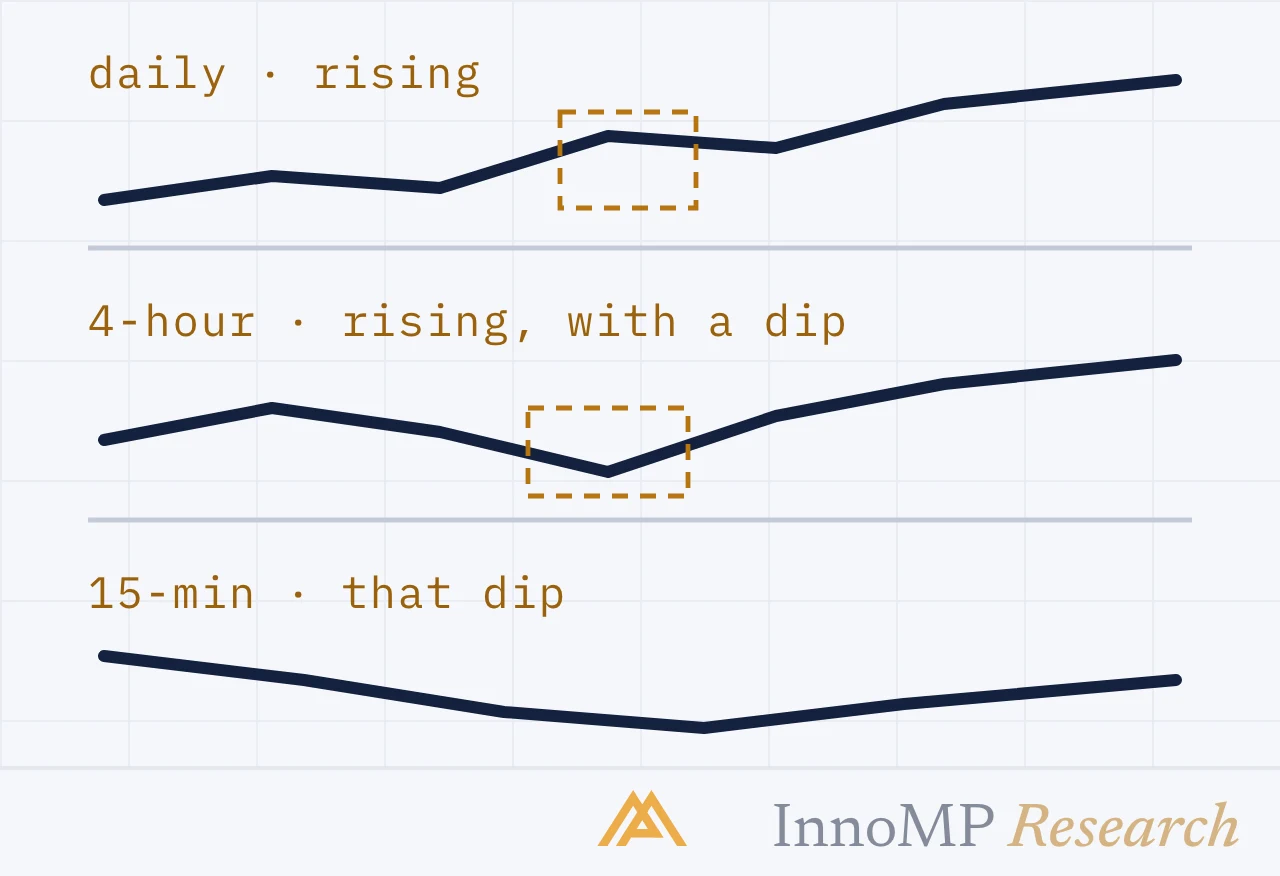
The 5-minute and the daily chart show the same market and can look completely different. This guide explains what a timeframe is, how to pick one, and why traders use two together.
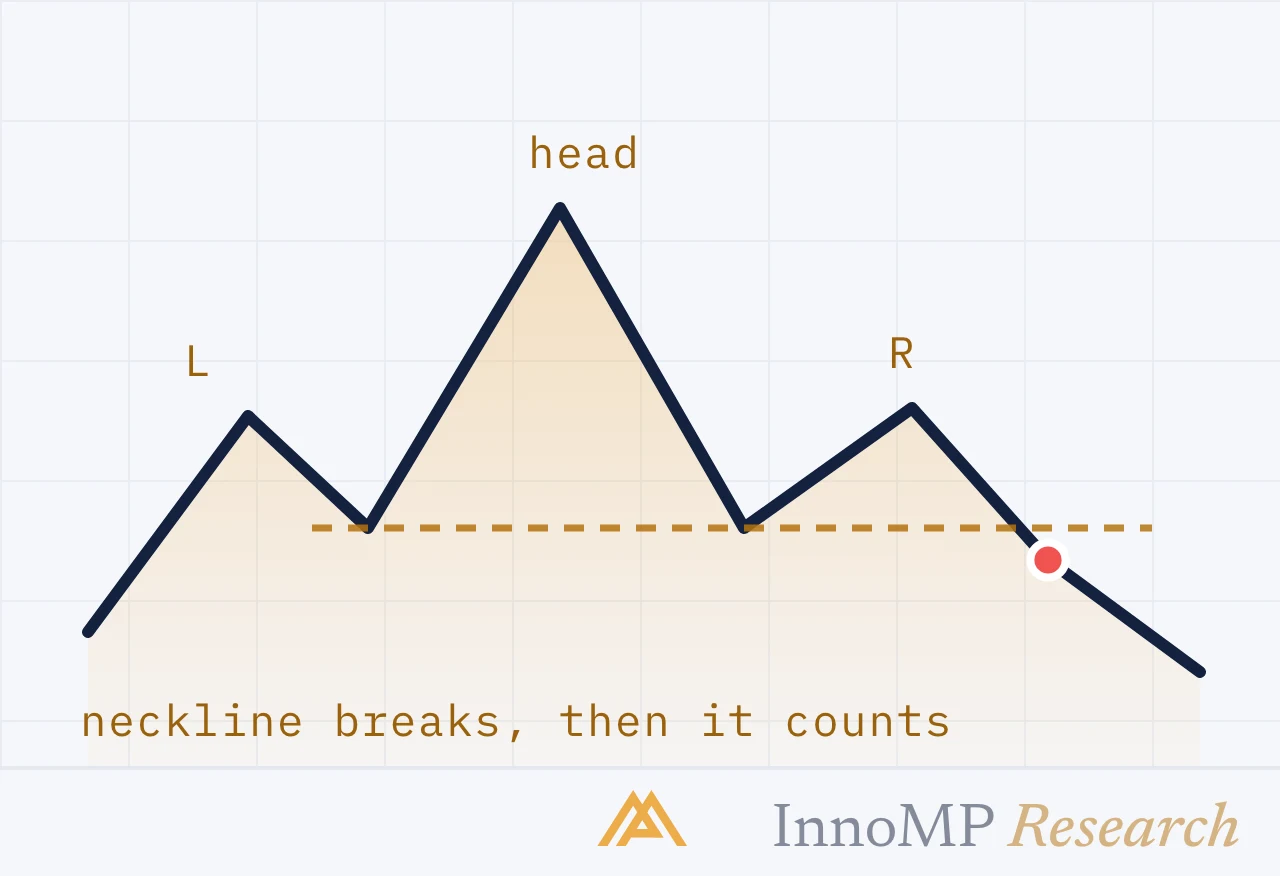
The reversal patterns everyone knows, explained through the structure that actually produces them — and the neckline that decides whether they mean anything.
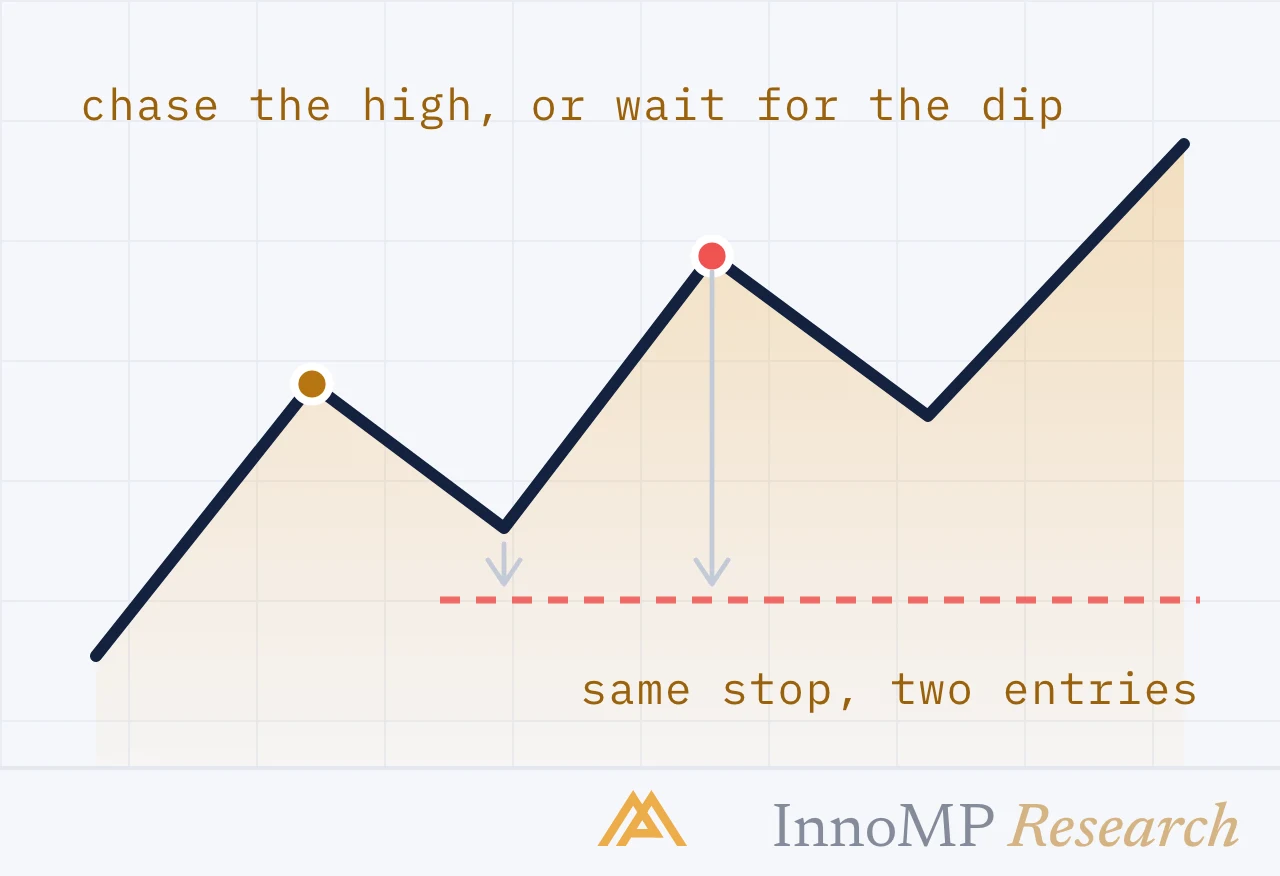
Buying a trend at its high is the most common way to be right about direction and lose money anyway. Why the entry price changes everything.
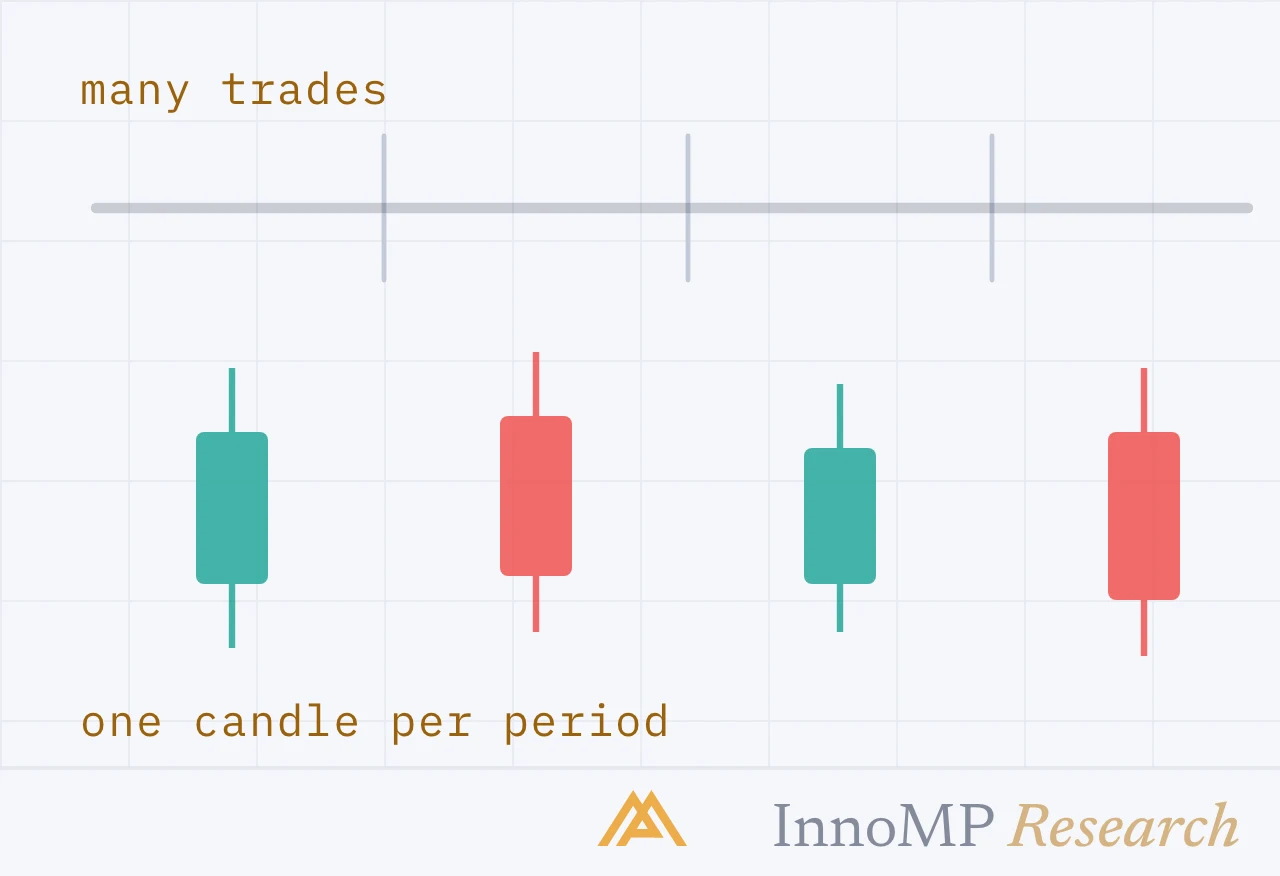
Line, bar and candlestick charts show the same data three ways. This guide explains what each one records, what a candle's body and wick mean, and why candlesticks became the standard.
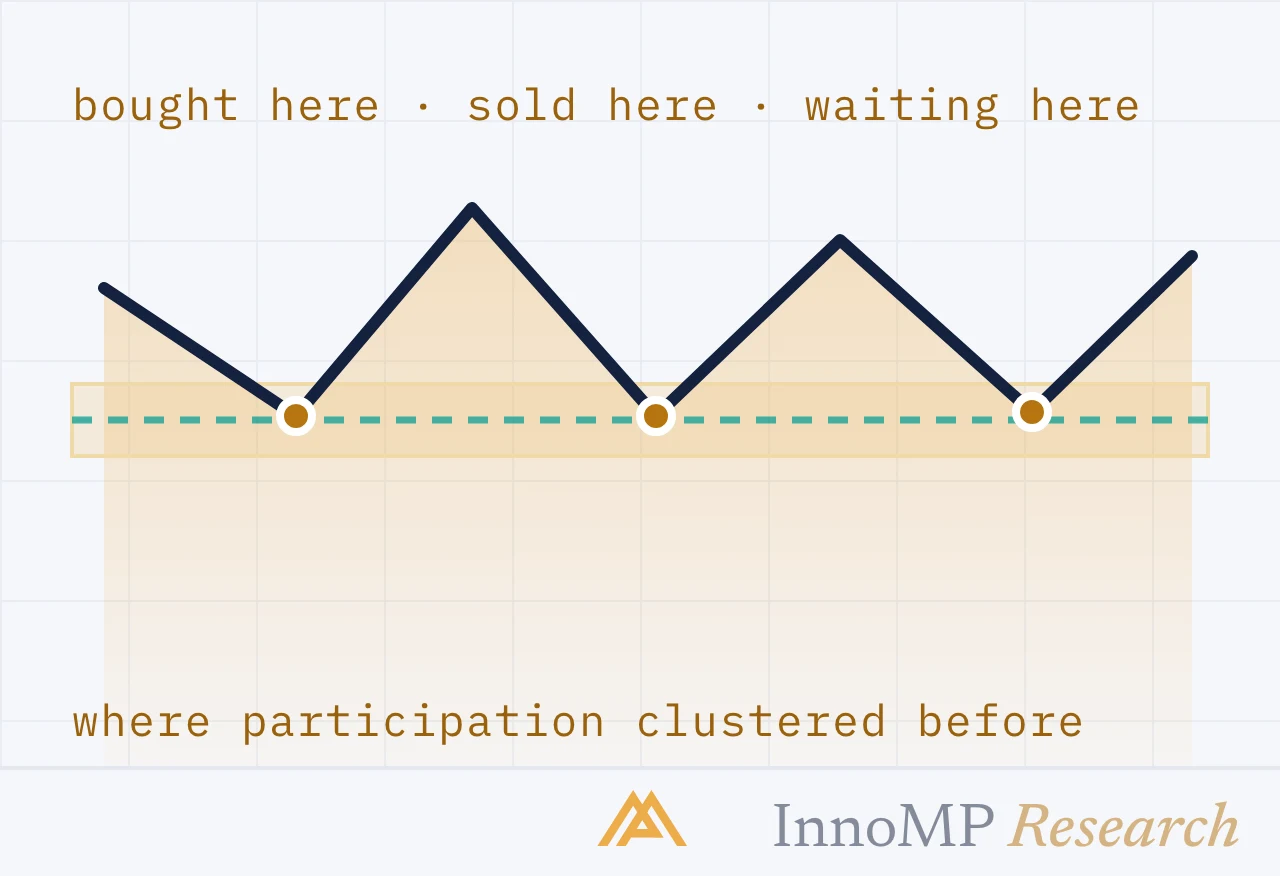
The most useful lines on any chart, and the most commonly drawn wrong. What these levels actually are, how to draw them as zones, and why a broken support becomes resistance.
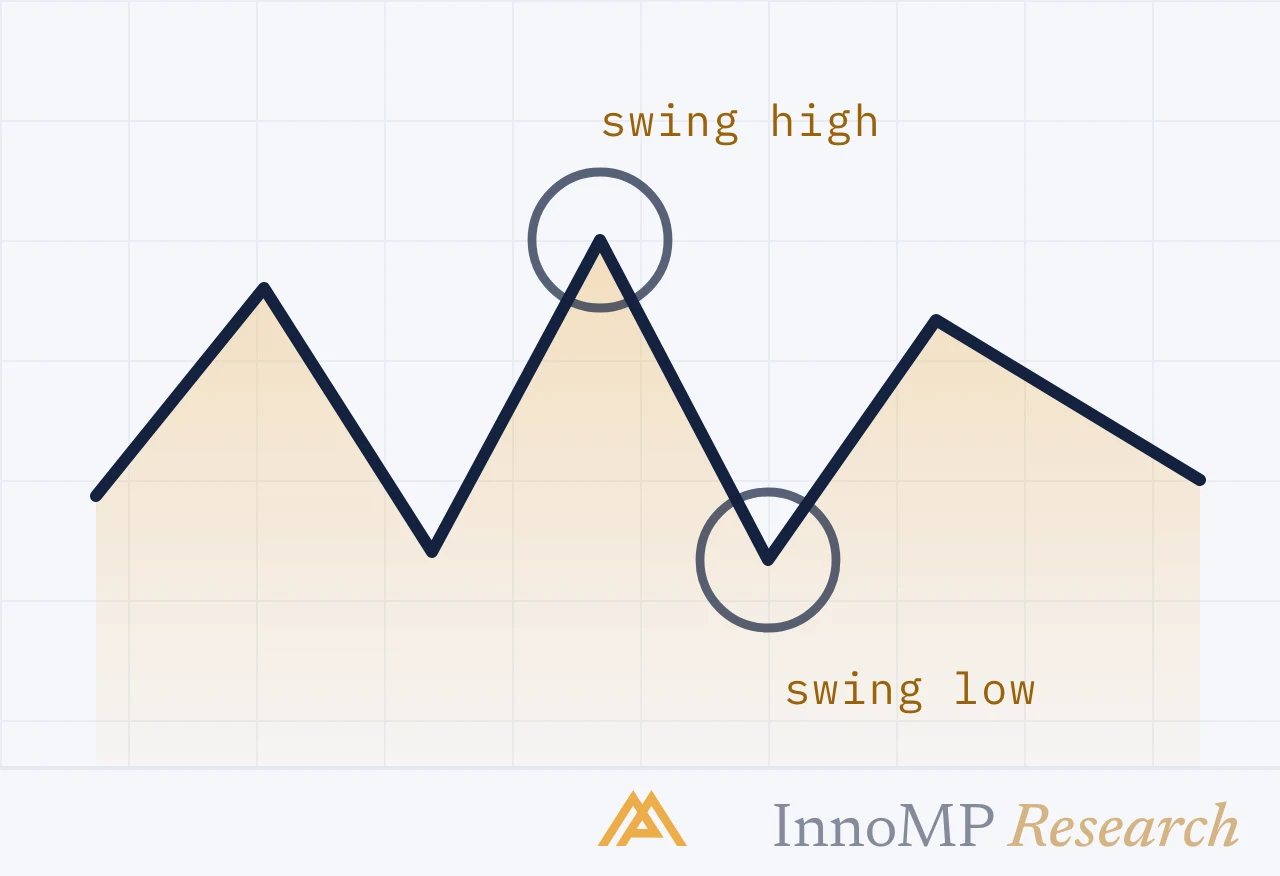
The skeleton beneath every chart pattern. How to spot the turning points mechanically, and how their order tells you when a trend has actually ended rather than paused.
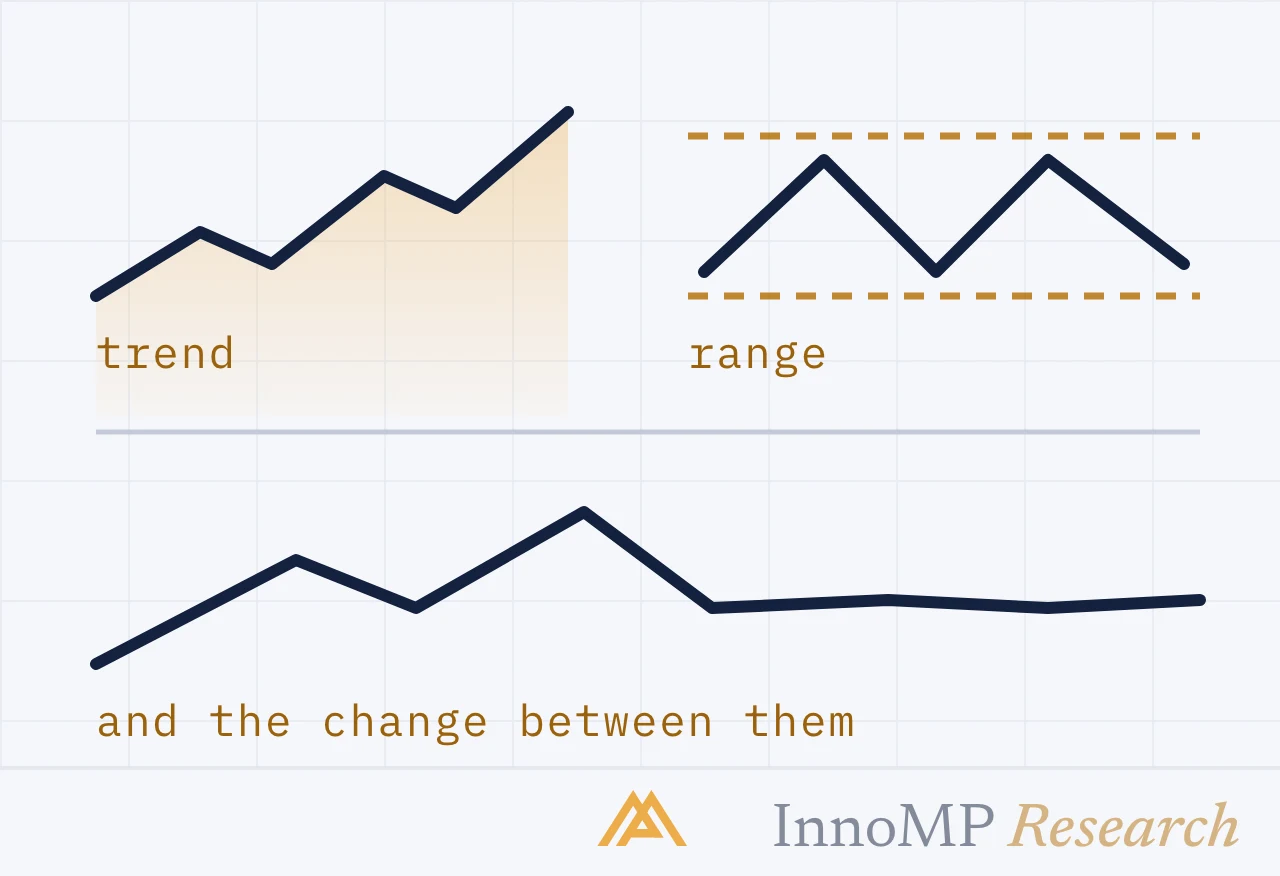
Before any indicator or pattern, answer one question: is this market going somewhere or going sideways? Getting it wrong means every tool you use afterwards is the wrong tool.
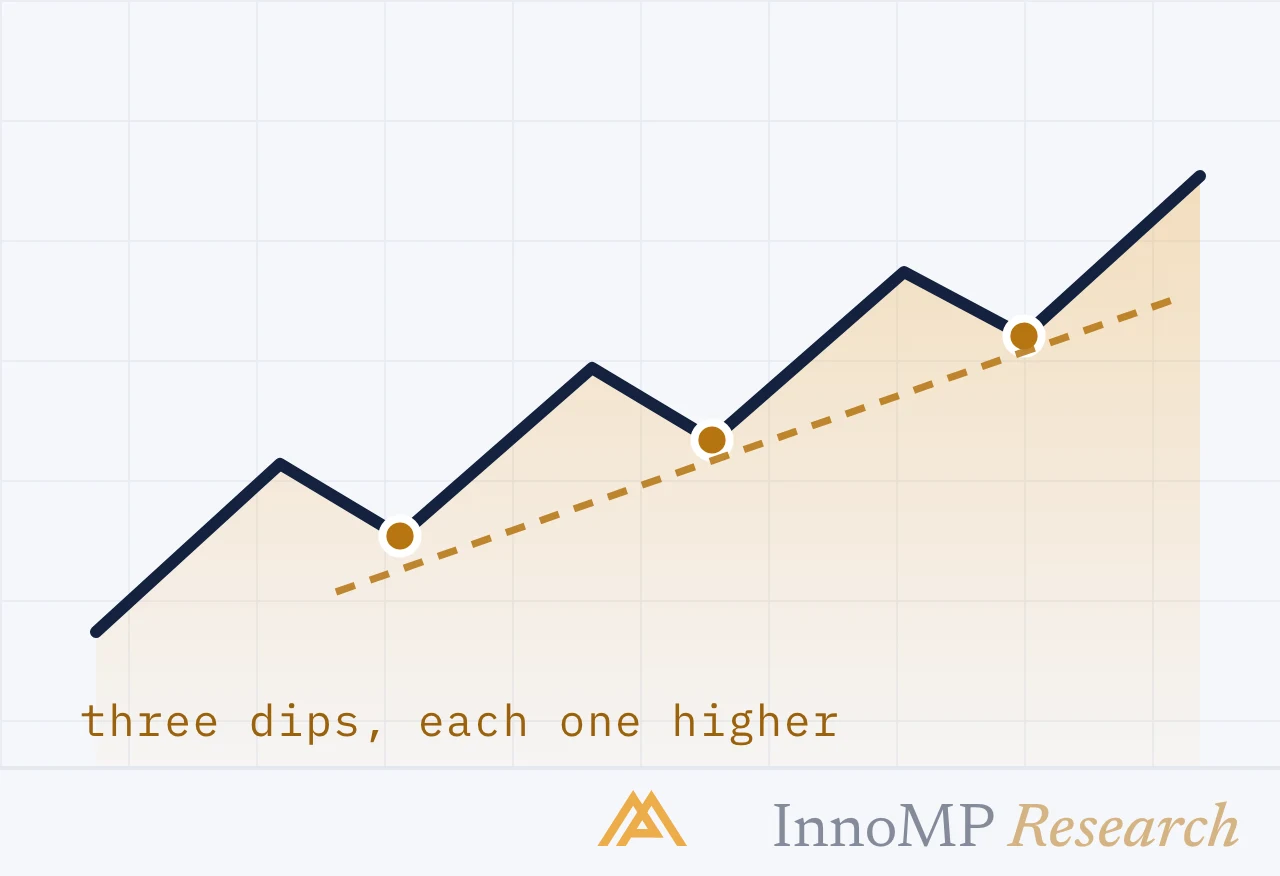
A trendline is support and resistance that moves. This guide shows how to draw one that is defensible, why two touches are not enough, and what a channel adds.
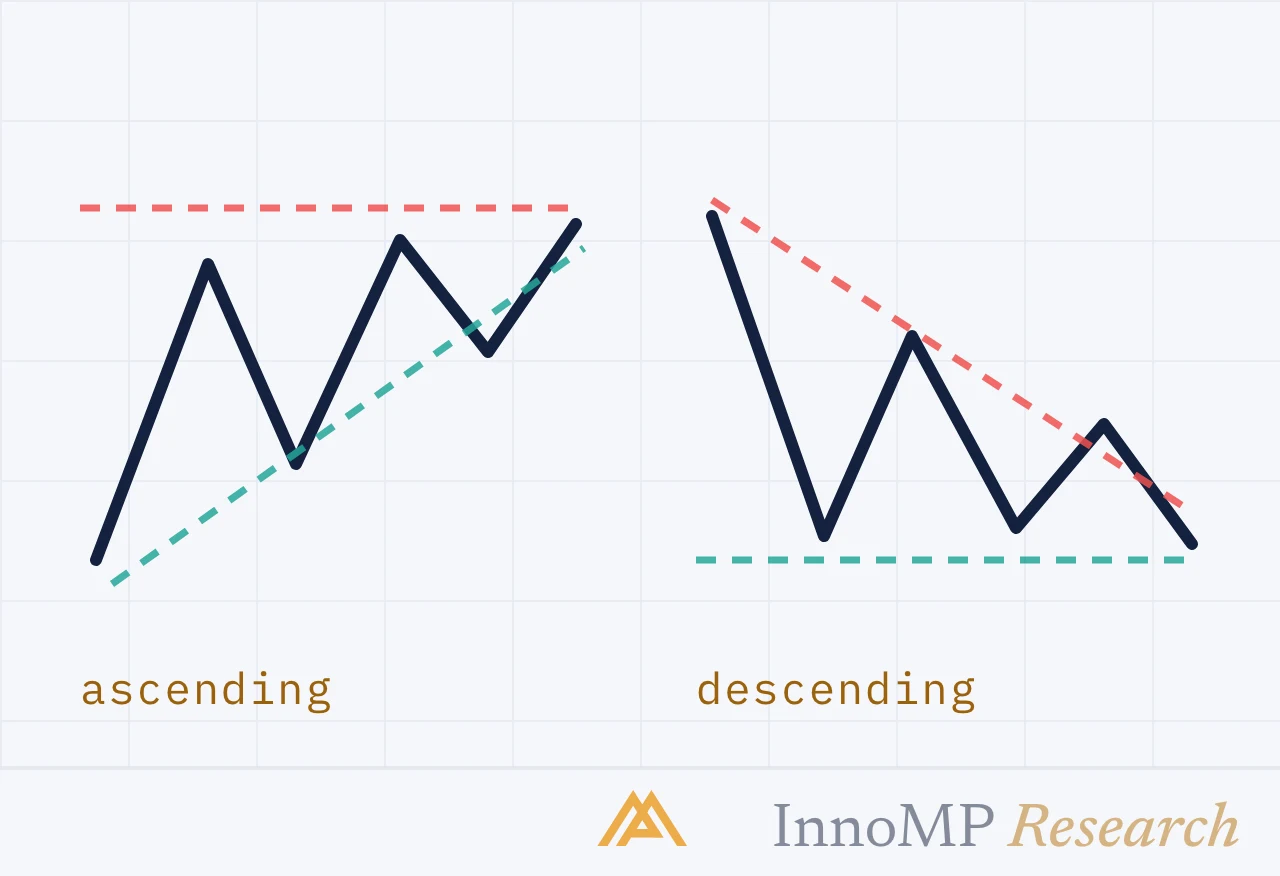
Four shapes that all describe the same thing — a market narrowing toward a decision. What each one's slope tells you, and why the breakout direction is not as predetermined as textbooks suggest.
A price chart is a record of what buyers and sellers actually did. This guide explains what technical analysis is, what it can and cannot tell you, and how to read your first chart — starting from zero.
What actually moves gold, how the XAUUSD contract works, the sessions that matter, and a sizing approach that respects the metal's volatility.
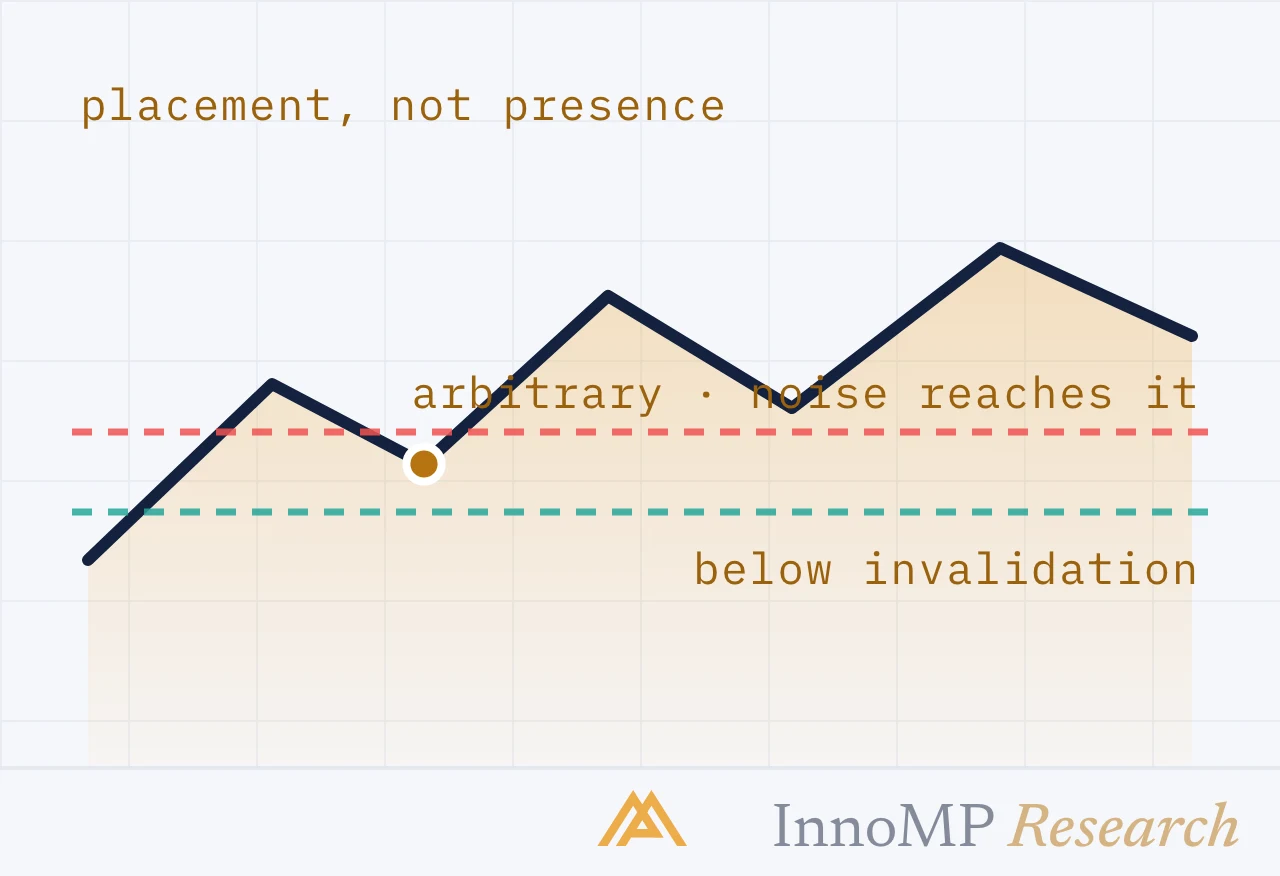
Having a stop is table stakes. Where it sits determines whether it protects the account or simply donates to the market on schedule.
Position sizingMarket hoursTrading costsIndicatorsRisk managementCFD basicsStop-lossChart patterns