Skip to content
Research / Education / Support & resistance

TA · Foundations · Part 6 of 20

How to draw trendlines and channels correctly

A trendline is support and resistance that moves. This guide shows how to draw one that is defensible, why two touches are not enough, and what a channel adds.

InnoMP Research Published 30 Aug 2026 · Updated 02 Sept 2026 7 min read
In short

A trendline connects rising lows in an uptrend or falling highs in a downtrend, acting as diagonal support or resistance. Two points draw it, but a third touch is what makes it evidence rather than a guess. A channel adds a parallel line on the other side of price, showing how wide the trend usually runs.

A trendline connects rising lows in an uptrend, or falling highs in a downtrend.

It is the same idea as support and resistance from Part 5 — a price area where participants have acted before — except the area moves as time passes.

Why a level would move

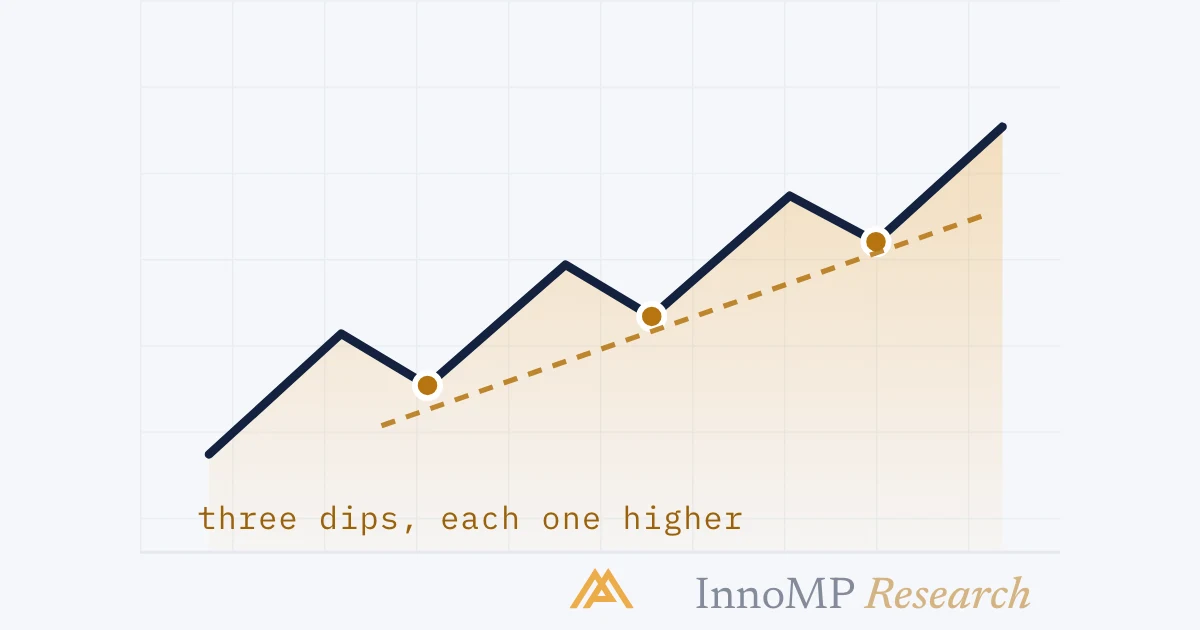
In a trend, buyers are willing to pay progressively more. So the price where they step in is not a fixed number; it rises with each pullback.

Drawing a horizontal line under a rising market would put it in the wrong place almost immediately. A tilted line follows.

A rising market where each dip stops higher than the last A rising price line with three dips marked by dots. Each dip stops at a higher level than the previous one, and a straight diagonal line drawn beneath connects all three. each dip is higher123 InnoMP Research
Each dip bottoms higher than the last. A horizontal line cannot describe that; a tilted one can.

How to draw one

In an uptrend, connect the dips (swing lows) with a line beneath price. In a downtrend, connect the peaks (swing highs) with a line above price.

Three rules keep it honest.

A correctly drawn trendline compared with one that cuts through price Two panels of the same rising price data. On the left the trendline sits beneath all the candles and touches the dips. On the right the line passes through the middle of several candles, marked as wrong. Correcttouches the dips,cuts nothingWrongpasses throughthe candlesThree rules1 · The line must not cut through price2 · Use the actual dips, not convenient points3 · Pick wicks or bodies — then stay consistent InnoMP Research
The line touches the dips and leaves everything between them alone. If it slices through candles, it was drawn to fit a wish rather than the chart.

On rule three: wicks include the full extreme, so lines drawn on them break more often on single spikes. Bodies ignore those spikes and give steadier lines. Either is defensible. Switching between them to make a line work is not.

Two points draw a line. Three make it evidence.

This is the part beginners skip, and it matters more than the drawing technique.

Any two points can be connected by a line. That is geometry, not analysis. A two-touch trendline is a guess with a ruler — it says if this rate of advance is real, price should react here again.

The third touch is the first evidence that the market is actually respecting it.

Why a third touch is required before trusting a trendline Two panels. The left shows two dots connected by a line, labelled a guess. The right shows the same line with a third dot landing on it, labelled evidence. Two touchesA guessany two pointsmake a lineThree touchesEvidencethe market reactedthere again InnoMP Research
Two points always connect — that proves nothing. The third touch is the market agreeing with your line.

This rule exists because trendlines are the easiest tool to fool yourself with. Given enough candles and freedom in choosing endpoints, a line can be drawn to support almost any view. Requiring three touches is the discipline that stops it.

Channels

A channel is a trendline plus a parallel line on the other side of price.

Draw the main line first, on whichever side has the cleaner touches. Then copy it — same angle — across to the opposite extreme.

An uptrend channel with an entry area and a profit-taking area A rising price line contained between two parallel diagonal lines. The lower line is shaded as an entry area where price has bounced twice, and the upper line is shaded as a profit-taking area where price has stalled twice. upper — where it pauseslower — where it is bought InnoMP Research
The lower line is where the trend has been bought. The upper is where it has paused. That gives an entry area and a target before you enter.

A channel gives you two things a single line cannot:

A width — how far the trend usually travels before pulling back, which makes targets realistic rather than hopeful.

Two zones — the lower boundary as a buy area in an uptrend, the upper as a place to take profit. That is a defined risk-reward setup instead of an open-ended trade.

Key takeaway Buying at the top of a rising channel is buying where the trend has historically paused. It feels safest there because the move looks strongest — which is exactly why beginners do it. The buy area is the bottom.

What a break actually means

A trendline break means the speed changed. Not that the trend ended.

Very often price breaks a steep line and keeps rising along a shallower one. The trend is intact; only its rate changed.

Whether the trend has truly ended is a question about swing structure — whether the sequence of higher highs and higher lows broke. That is Part 7, and it is the more reliable test.

Steepness is information

A trendline’s angle tells you something on its own.

Very steep lines break early. They describe a pace no market sustains, so the break usually signals a return to normal speed rather than a reversal.

A trend that keeps steepening — each new line sharper than the last — is accelerating. That is when volatility rises, and it is worth rechecking position size: the same number of lots carries more risk in a faster market.

A steep trendline, a sustainable one, and a flattening series Three panels. The first shows a very steep rising line that price breaks quickly. The second shows a moderate line with several clean touches. The third shows a series of progressively flatter lines as the advance loses pace. Steep · breaks earlyModerate · holdsFlattening · fading InnoMP Research
Angle is a pace reading. Steep means unsustainable, moderate means healthy, flattening means the move is running out.

A flattening series of lines describes a trend running out of momentum — often the transition into the sideways condition from Part 4.

Next: Swing highs and lows — the objective structure that trendlines only approximate.

Key facts
  • An uptrend line connects rising swing lows and sits beneath price.
  • A downtrend line connects falling swing highs and sits above price.
  • Two points draw a line; the third touch is the first real evidence.
  • A trendline break means the rate of advance changed — not necessarily that the trend ended.
Frequently asked questions

How do you draw a trendline?

In an uptrend, connect two or more swing lows with a line beneath price. In a downtrend, connect swing highs above price. The line should touch those points without cutting through the candles in between.

Should trendlines be drawn on wicks or bodies?

Both conventions are used. Wicks capture the full extreme; bodies ignore single-candle spikes and produce fewer false breaks. Pick one and apply it every time rather than switching to make a line work.

How many touches does a trendline need to be valid?

Two to draw it, three to trust it. Any two points can be connected by a line, so a two-touch trendline carries no evidence that the market respects it.

What does it mean when a trendline breaks?

That the speed of the trend changed. Many breaks simply lead to a shallower trendline rather than a reversal. Whether the trend actually ended is answered by the swing structure, not the line.

What is a price channel?

A trendline plus a parallel line on the opposite side of price. It frames how wide the trend usually runs, giving both an entry area on one side and a profit-taking area on the other.

InnoMP Research

Market research, trading education and platform guides from the InnoMP research desk — covering forex, metals, indices and stock CFDs.

Published 30 Aug 2026 · Updated 02 Sept 2026 · Reviewed by InnoMP Compliance

Disclaimer: This content is provided for general informational purposes only and does not constitute investment advice, an offer, or a solicitation to buy or sell any financial instrument. It has been prepared without regard to your individual financial circumstances or objectives. Trading CFDs involves a high risk of loss.

Related notes

Market structure

Swing highs and lows: reading market structure

The skeleton beneath every chart pattern. How to spot the turning points mechanically, and how their order tells you when a trend has actually ended rather than paused.

7 min read