Skip to content
Research / Education / Support & resistance

TA · Foundations · Part 5 of 20

Support and resistance explained for beginners

The most useful lines on any chart, and the most commonly drawn wrong. What these levels actually are, how to draw them as zones, and why a broken support becomes resistance.

InnoMP Research Published 30 Aug 2026 · Updated 01 Sept 2026 8 min read
In short

Support is a price area where buying has previously been strong enough to stop a fall. Resistance is where selling has stopped a rise. They are zones rather than exact lines, they matter more with each additional touch and on higher timeframes, and a broken support level often becomes resistance afterwards — a role reversal called a flip.

Support is an area where buying has stopped a fall. Resistance is an area where selling has stopped a rise.

These are the most useful lines on any chart, and the most commonly drawn wrong. Understanding why they work tells you how to draw them, so start there.

Why price reacts at old levels

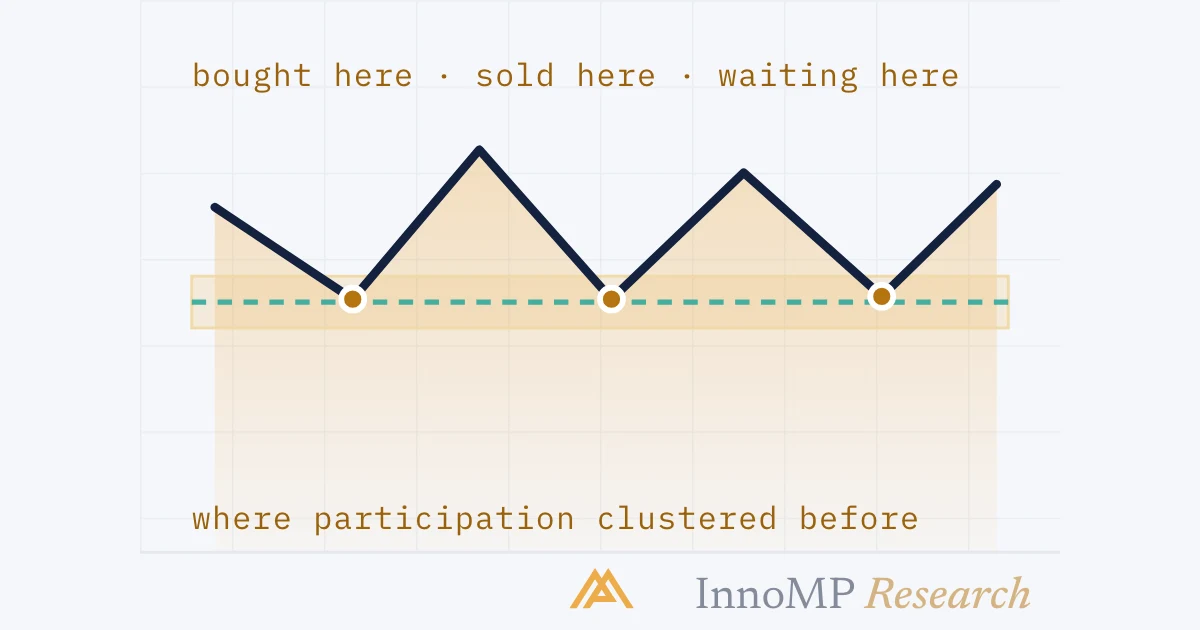
There is nothing mystical about it. Three groups of traders want the same price for different reasons.

Suppose price fell to 1.0800, bounced hard, and rallied 200 pips. Later it comes back to 1.0800.

  • Traders who bought that first bounce and closed early want to buy again — they watched it work.
  • Traders who missed the bounce have been waiting for a second chance at that price.
  • Traders who sold near the low and got hurt want out at breakeven, which means buying back at 1.0800.

Three different motivations, one price. Orders pile up there, and price reacts.

Three groups of traders placing orders at the same old level A price chart showing a bounce from a horizontal level followed by a rally and a return to the same level. Three labelled callouts point at the level, representing traders who bought the first bounce, traders who missed it, and traders who sold and want to break even. 1st bouncereturns here· bought the bounce, want more· missed it, waiting for round two· sold the low, want out at breakeven InnoMP Research
The level works because people remember it. Three different reasons, one price, and enough orders to matter.

Draw zones, not lines

The most common beginner error is treating a level as one exact price.

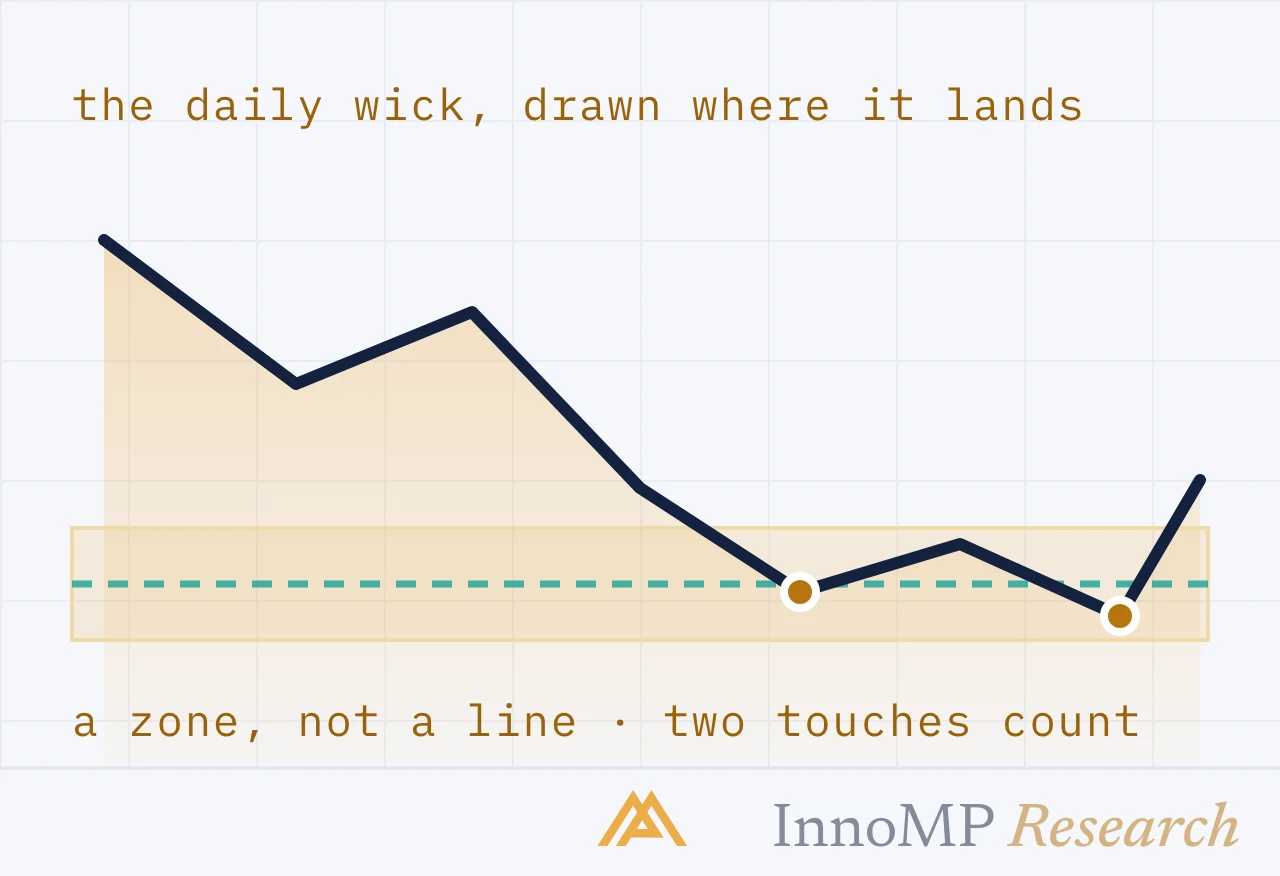
Look at any level touched several times and the touches will not line up perfectly — one wick overshoots, one reversal falls short. That scatter is the level. Its width tells you the range in which participants were willing to act.

A level drawn as a single line compared with the same level drawn as a zone Two panels showing the same four price touches. On the left a single thin line passes through them, with two touches clearly missing it. On the right a shaded band covers all four touches, with the candle bodies inside the core and the wicks reaching the edges. As a linetwo touches miss it —was the level wrong?As a zoneall four inside the band —the width is the information InnoMP Research
The touches never line up exactly. A band that covers the scatter is a more honest description than a line that pretends it away.

How to draw one:

  1. Find at least two reversals at roughly the same price
  2. Use the candle bodies for the core — bodies are where price settled
  3. Use the wicks for the outer edge — wicks show where the fight happened
  4. Draw the band

This matters directly for stop placement. A stop inside a support zone is not protected by that zone — it sits in the area where the fight is expected.

What makes a level important

Not all levels deserve equal attention. Four things increase weight:

Timeframe. A daily level beats a 15-minute one, for the reason in Part 3 — more participants formed it.

Number of touches. Two is minimum, three or more confirms. But note the tension: each test uses up orders. A level tested seven times is well established and progressively weaker, which is why heavily tested levels eventually break.

Reaction strength. A level that produced a sharp 200-pip reversal matters more than one that produced a 20-pip pause.

Recency. Last week’s level is fresher in people’s minds than one from three years ago.

The flip: support becomes resistance

This is one of the more dependable behaviours on a chart, and it gives beginners some of the cleanest setups available.

When support breaks, it frequently becomes resistance. When resistance breaks, it frequently becomes support.

The mechanism is the same order logic as before, with the groups reversed. Buyers who defended the old support are now underwater and sell into a return to that price. Traders who sold the break want to add on a retest. Both act at the same level, from the opposite side.

A support zone breaking and then acting as resistance A price line that bounces from a shaded horizontal band twice, then breaks below it, and afterwards rallies back up to the same band and is rejected downward from underneath it, illustrating the flip from support to resistance. support → resistance12breakretest — rejected InnoMP Research
The same band, two roles. Once broken, what had been catching price from above starts capping it from below.

The flip is valuable because the point of being wrong is unusually clear: if price closes back through the flipped level, the read was wrong.

Key takeaway A level is not a prediction that price will turn. It is a place where a reaction is more likely and — more usefully — where you know exactly what “wrong” looks like. That second property is what makes levels tradeable at all.

The four things that make a level more important Four stacked rows, each naming a factor that increases a level's weight: the timeframe it appears on, the number of touches, the strength of the reaction, and how recent it is. Each row carries a one line explanation. 1 · Timeframedaily beats 15-minute — more people formed it2 · Number of touchestwo is minimum, three or more confirms3 · Reaction strengtha sharp reversal beats a small pause4 · How recentlast week is fresher than three years ago InnoMP Research
Weigh a level against these four before trading it. A daily level touched three times with a sharp reaction is a very different thing from a 5-minute level touched twice.

Round numbers

Prices ending in round figures — 1.1000, 150.00, 2,400 — attract orders for no reason beyond humans liking round numbers. Standing orders and stop placements gather there.

The practical consequence: place stops beyond a round number, never exactly on it. Clustered stops are visible liquidity, and price reaches for them more often than chance would suggest.

Where to place a stop relative to a round number A price chart with a horizontal line at a round number labelled 1.1000. A cluster of stop markers sits directly on the line and is shown being triggered by a price spike. A second stop marker placed further beyond the round number survives the same spike. 1.1000 — a round numberstops cluster hereprice dips through, then reversesPlace your stop here insteadbeyond the cluster, with a buffer InnoMP Research
Stops pile up on round numbers, and price reaches for them. Place yours beyond the cluster, not inside it.

Automate the watching

You do not need to sit at a chart waiting for price to reach a level. Mark your zones in a calm moment, then set a Market Watcher alert at each one. The alert brings you back at the price you cared about.

That habit also prevents a problem covered later in the course: watching a chart for hours is what produces impatient trades.

Next: Trendlines and channels — the same logic applied to levels that move.

Key facts
  • Support and resistance are zones, so draw them with width rather than as single lines.
  • A level matters more with each touch and on higher timeframes.
  • Broken support commonly becomes resistance, and broken resistance becomes support.
  • Round numbers attract clustered orders, so stops belong beyond them rather than on them.
Frequently asked questions

What is support and resistance in trading?

Support is a price area where buyers have previously stepped in strongly enough to stop a fall. Resistance is where sellers have stopped a rise. They matter because participants remember these prices and place orders around them, which tends to reproduce the same reaction.

How do I draw support and resistance correctly?

Mark the areas where price reversed more than once. Use the candle bodies for the core of the zone and the wicks for its outer edge, and draw a band rather than a single line. Prefer levels visible on a higher timeframe.

Why does support become resistance after it breaks?

Traders who bought at the old support are now losing and often sell to break even if price returns. Traders who sold the break want to add on a retest. Both groups place orders at the same price, which turns former support into a selling area.

How many touches make a level valid?

Two is the minimum, since one point defines nothing. Three or more increases its significance, though a level touched many times has also been progressively weakened, because each test uses up some of the orders defending it.

Should I draw levels on candle wicks or bodies?

Both, as the edges of one zone. Bodies mark where price settled and form the core of the zone; wicks mark rejected attempts and form its outer edge. Drawing a band that covers both is more realistic than choosing one.

InnoMP Research

Market research, trading education and platform guides from the InnoMP research desk — covering forex, metals, indices and stock CFDs.

Published 30 Aug 2026 · Updated 01 Sept 2026 · Reviewed by InnoMP Compliance

Disclaimer: This content is provided for general informational purposes only and does not constitute investment advice, an offer, or a solicitation to buy or sell any financial instrument. It has been prepared without regard to your individual financial circumstances or objectives. Trading CFDs involves a high risk of loss.

Related notes