Skip to content
Research / Education / Chart patterns

TA · Foundations · Part 13 of 20

Head and shoulders, double tops and double bottoms

The reversal patterns everyone knows, explained through the structure that actually produces them — and the neckline that decides whether they mean anything.

InnoMP Research Published 30 Aug 2026 · Updated 02 Sept 2026 7 min read
In short

A head and shoulders is a three-peak reversal pattern where the middle peak is highest and the outer two are roughly level, completed when price closes below the neckline joining the intervening lows. A double top is two peaks at a similar level completed on a break of the low between them. Both describe the same underlying event: a trend failing to make a new high and then breaking its prior low.

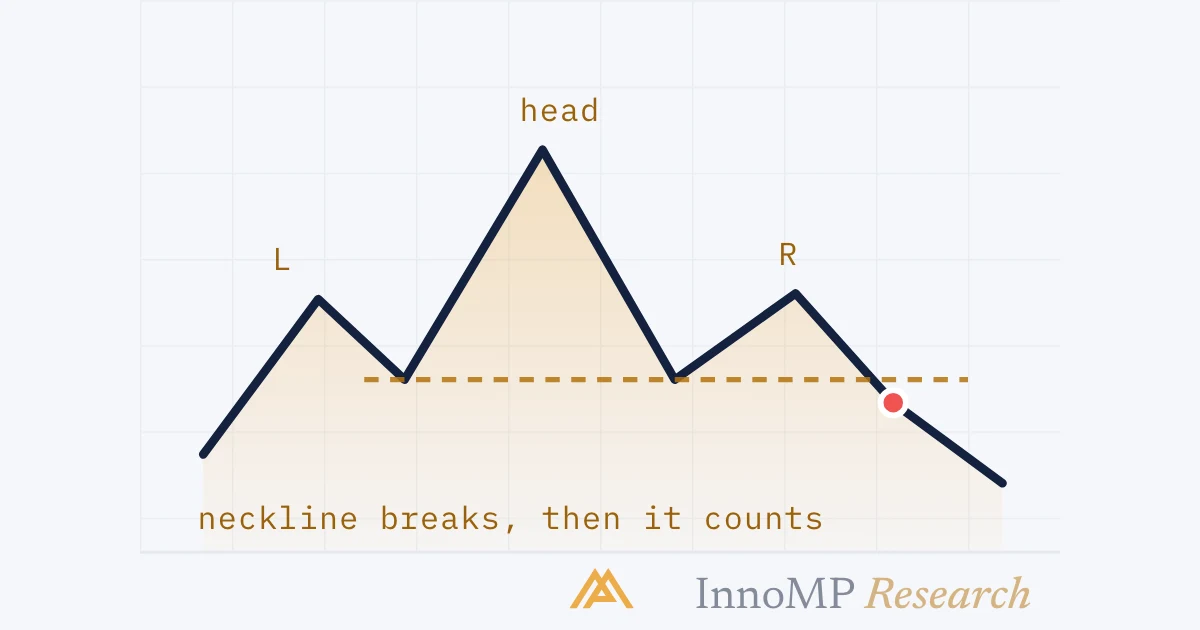
A head and shoulders is three peaks with the middle one highest, completed when price closes below the neckline joining the intervening lows. A double top is two peaks at a similar level, completed on a break of the trough between them.

Both are famous. Both are also, underneath the naming, exactly the same event described in Part 7: a trend fails to make a higher high, then breaks its prior swing low. Recognising that keeps the patterns useful rather than mystical.

Head and shoulders, structurally

Walk through what forms it in an uptrend.

A head and shoulders top with its four stages numbered A three-peak formation with the middle peak highest. The peaks are numbered left shoulder, head and right shoulder, a dashed neckline joins the two lows between them, and a fourth marker shows price closing below that neckline. neckline1 left2 head3 right4 break InnoMP Research
Stage three is the warning — a peak that failed to exceed the last one. Stage four is the confirmation, when the low between them gives way.
  1. Left shoulder — a normal higher high, then a pullback. Trend intact.
  2. Head — another higher high. Still intact. Then a pullback reaching roughly the previous level.
  3. Right shoulder — a rally that fails to exceed the head. This is the lower high. The uptrend is now in question.
  4. Neckline break — price falls through the level joining the two pullback lows. The structure is broken.

Step 3 is the warning; step 4 is the confirmation. The pattern is not a mystical shape — it is a sequence in which the higher-high requirement fails and then the higher-low requirement fails.

An inverse head and shoulders forming at the end of a downtrend Three troughs with the middle one lowest, mirroring the head and shoulders shape upside down, with a neckline joining the two peaks between them and price breaking upward through it. necklinehigher lowbreak InnoMP Research
The same sequence upside down: a low that fails to go lower, then the level above gives way.

The inverse head and shoulders is the same in a downtrend, with three troughs and the middle one lowest.

Double tops and bottoms

Simpler and more common. Price reaches a level, retreats, returns to the same level, and fails again.

A double top with two failures at the same price and the trough break Two peaks at the same height with a horizontal line drawn across them, a trough between them with a horizontal line at its level, and price breaking below that trough line after the second peak. twice rejectedtroughbreak InnoMP Research
Twice unable to pass the same price. The second failure carries the weight, because it shows the first was not an accident.

The information is straightforward: buyers were twice unable to push beyond this price. The second failure carries more weight than the first because it demonstrates the first was not an accident.

Completion again requires the break — of the trough between the peaks. Two peaks at a level with no break is just resistance holding twice, which is normal range behaviour, not a reversal.

The neckline is the pattern

The most common error with all of these is trading the shape before the break.

A prospective head and shoulders that never completes A formation that looks like a head and shoulders in progress, with an entry marker on the right shoulder. Price then rallies upward through where the right shoulder should have topped, above the head, with the neckline never broken. neckline — never brokenshorted heretrend continues InnoMP Research
The pattern that never formed. Shorting the right shoulder means being positioned against an uptrend that was never broken.

A prospective head and shoulders is visible long before it completes, and traders routinely short the right shoulder in anticipation. The problem: a great many prospective patterns never complete. Price rallies through where the right shoulder “should” have topped and the uptrend continues, having never been broken.

Until the neckline goes, an uptrend making a lower high is an uptrend that made a lower high. That is a caution flag, not a reversal.

Key takeaway The pattern is the confirmation, not the shape. Anticipating completion converts a defined-risk setup into a guess about a formation that may never form — and gives up the one thing these patterns offer, which is an unambiguous invalidation level.

Trading them

Entry. On the neckline break, or on the retest of the neckline from the other side. The retest is the flip again — same trade-off as breakouts: the retest gives up some move for a tighter stop and better ratio.

Stop. Above the right shoulder for a head and shoulders; above the second peak for a double top. That is where the pattern has failed.

Target. Measured from the pattern’s height — which is Part 15.

Size. These are large patterns, so stops are wide and positions correspondingly small. Check the number in the calculator rather than assuming your usual size applies.

Where they are worth most

On higher timeframes, and at levels that already mattered.

A daily double top at an old level compared with a five-minute one in mid-range Two panels. The left shows a double top forming exactly on a shaded band labelled level from six months ago. The right shows a small double top in the middle of a sideways five-minute chart with no level nearby. capped price 6 months agoDailytwo reasons agree5-minutea squiggle with a name InnoMP Research
Same pattern name, opposite weight. Timeframe and location decide it, exactly as they did for every tool in this series.

A daily double top at a level that capped price six months ago is two independent pieces of evidence agreeing. A 5-minute double top in mid-range is a squiggle with a name. Timeframe and location decide the weight, exactly as they did for every tool in this series.

Next: Triangles, wedges and rectangles — the patterns of compression rather than reversal.

Key facts
  • A head and shoulders has three peaks, the middle one highest, with a neckline joining the two lows between them.
  • The pattern is not complete until price closes beyond the neckline.
  • A double top is two peaks at a similar price; a double bottom is the inverse.
  • Both patterns are formalisations of a break of market structure.
Frequently asked questions

What is a head and shoulders pattern?

A three-peak formation where the middle peak (head) is higher than the two outer peaks (shoulders). A line drawn through the lows between the peaks is the neckline; the pattern completes when price closes beneath it, signalling that the uptrend has failed.

What is a double top?

Two peaks at approximately the same price separated by a trough. It shows buyers twice failing to push beyond a level. The pattern completes when price breaks below the trough between the peaks.

When is a head and shoulders pattern confirmed?

Only when price closes beyond the neckline. Until then the shape is a possibility, not a pattern — and a great many prospective head and shoulders formations resolve by continuing upward instead.

How reliable are these patterns?

They formalise a genuine structural event — a failure to make a new high followed by a break of the prior low — which is why they persist. But no pattern has a fixed success rate, and patterns identified before the neckline breaks are speculation rather than analysis.

InnoMP Research

Market research, trading education and platform guides from the InnoMP research desk — covering forex, metals, indices and stock CFDs.

Published 30 Aug 2026 · Updated 02 Sept 2026 · Reviewed by InnoMP Compliance

Disclaimer: This content is provided for general informational purposes only and does not constitute investment advice, an offer, or a solicitation to buy or sell any financial instrument. It has been prepared without regard to your individual financial circumstances or objectives. Trading CFDs involves a high risk of loss.

Related notes

Trading emotions

FOMO: chasing the move you already missed

The setup came and went without you. Then price runs, and entering late feels urgent. Why chased entries carry the worst risk-reward on the chart.

5 min read