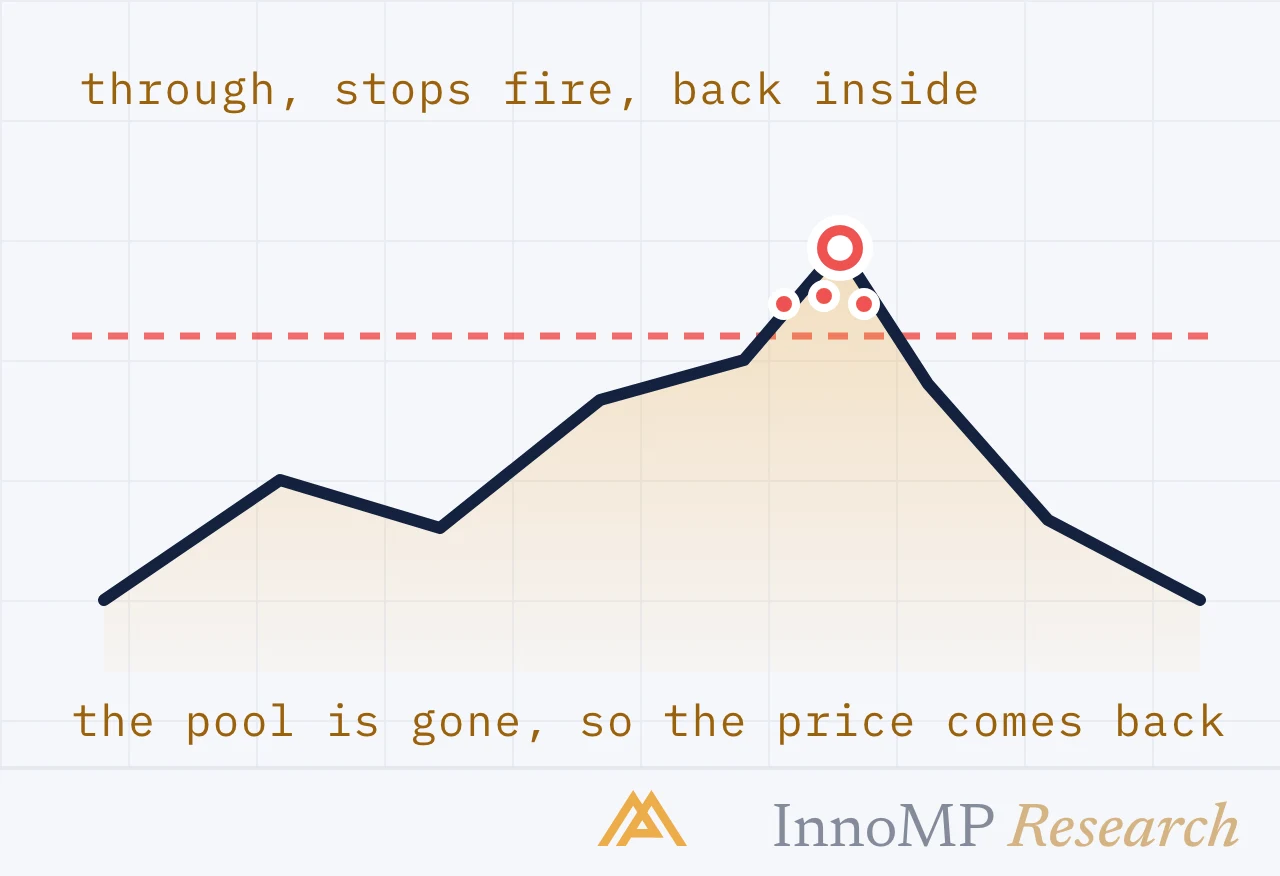
Market structure
Price pushes through an obvious level, triggers the stops resting beyond it, and comes straight back. What a sweep is mechanically, why it happens where it does, and how to tell it from a break that is going to hold.
Read more → 8 min read
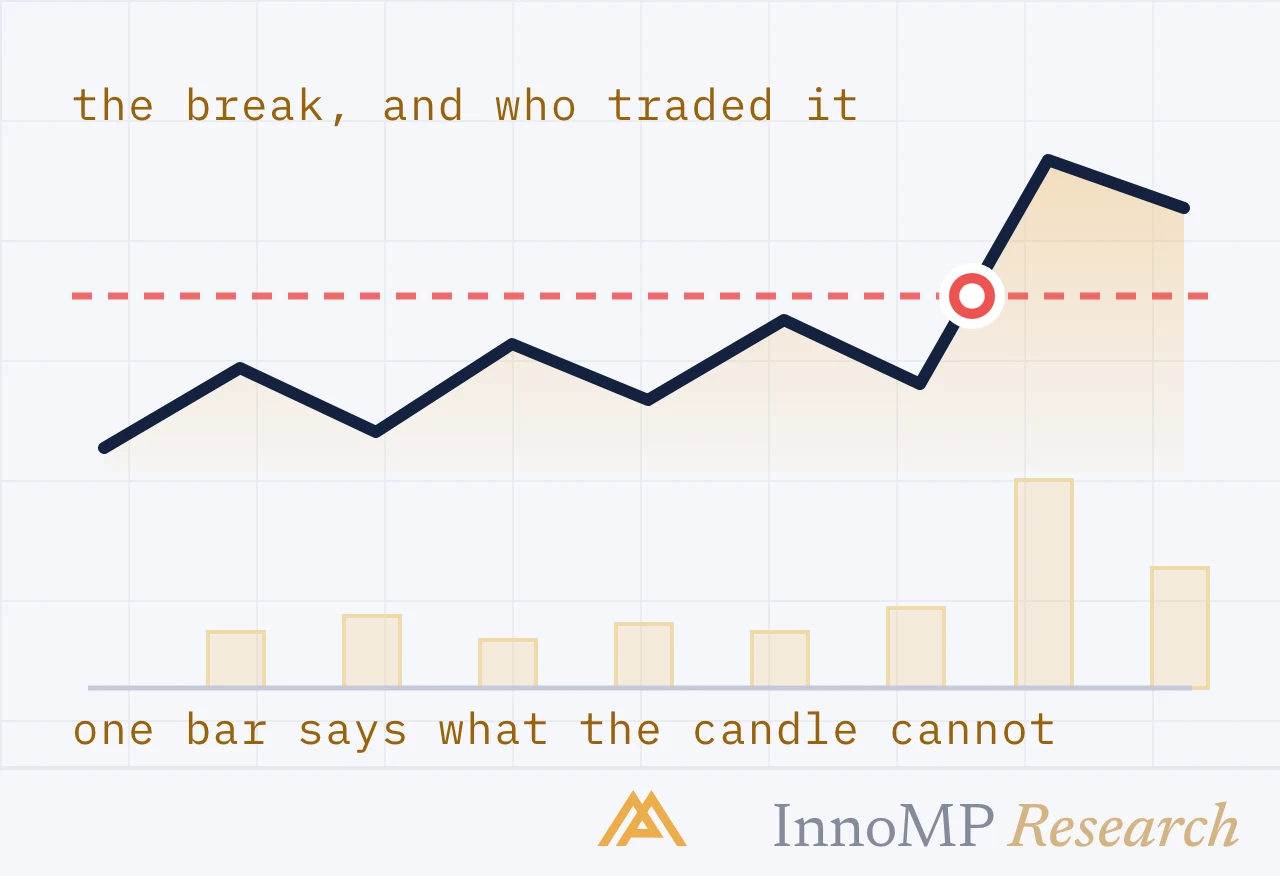
Market structure
The two moments participation matters most: when price leaves a range, and when a move runs out. How to read tick volume at the break, at the retest and at the end of a trend — against the right baseline.
Read more → 8 min read
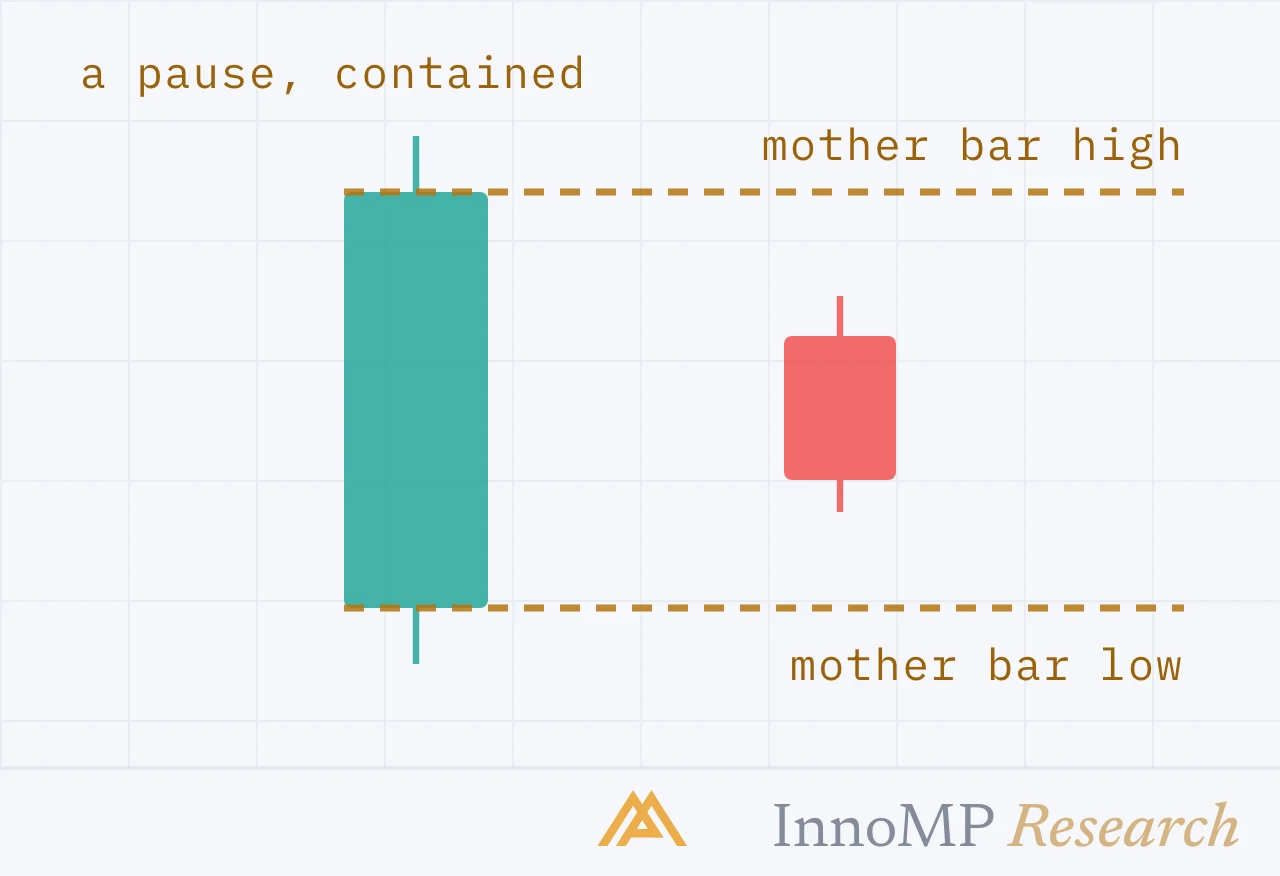
Candlesticks
Inside bars, flags and pennants. How to tell a trend catching its breath from a trend running out of it — and why the two look similar for the first few candles.
Read more → 5 min read
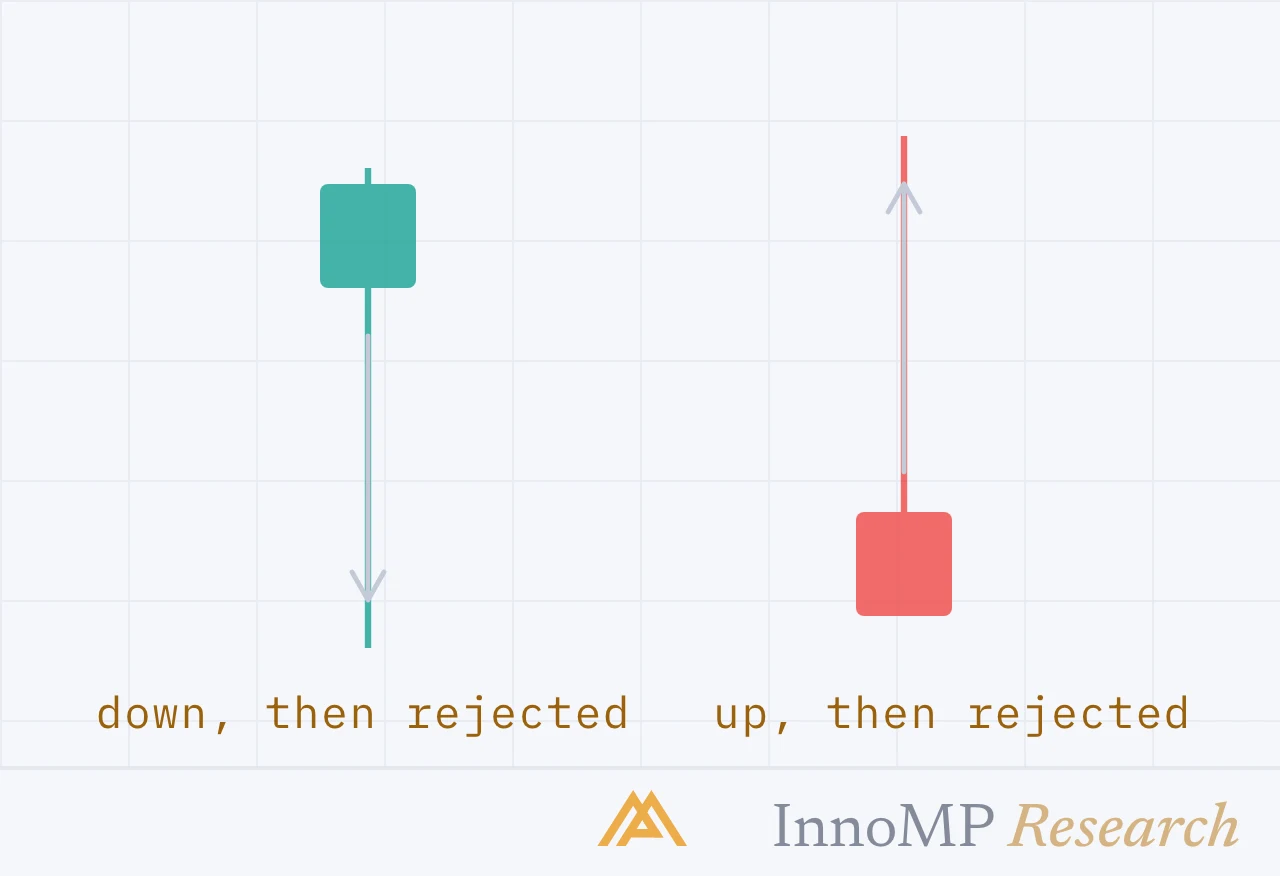
Candlesticks
Pin bars, engulfing candles and the two-bar reversal. Four patterns that carry real information — and the level context without which none of them mean anything.
Read more → 5 min read
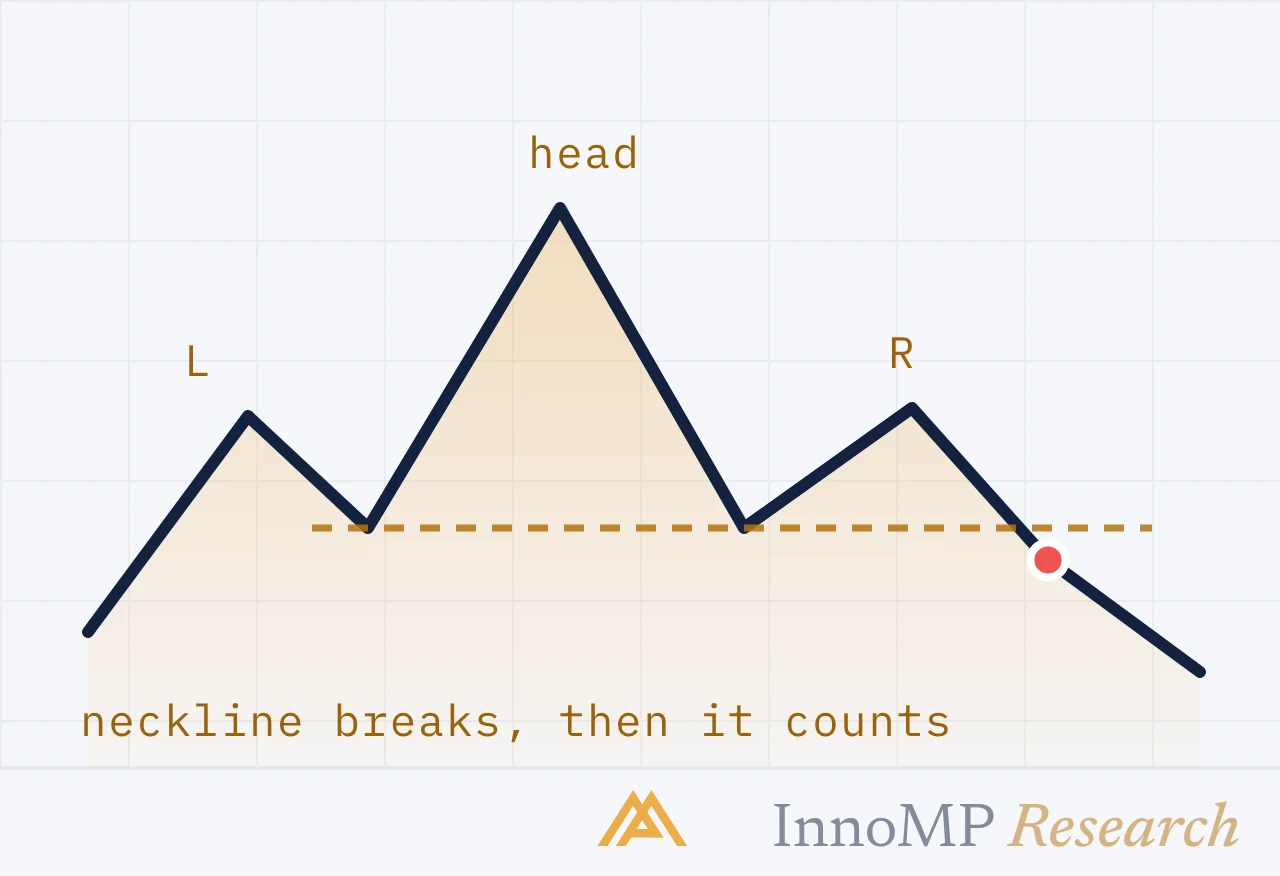
Chart patterns
The reversal patterns everyone knows, explained through the structure that actually produces them — and the neckline that decides whether they mean anything.
Read more → 5 min read
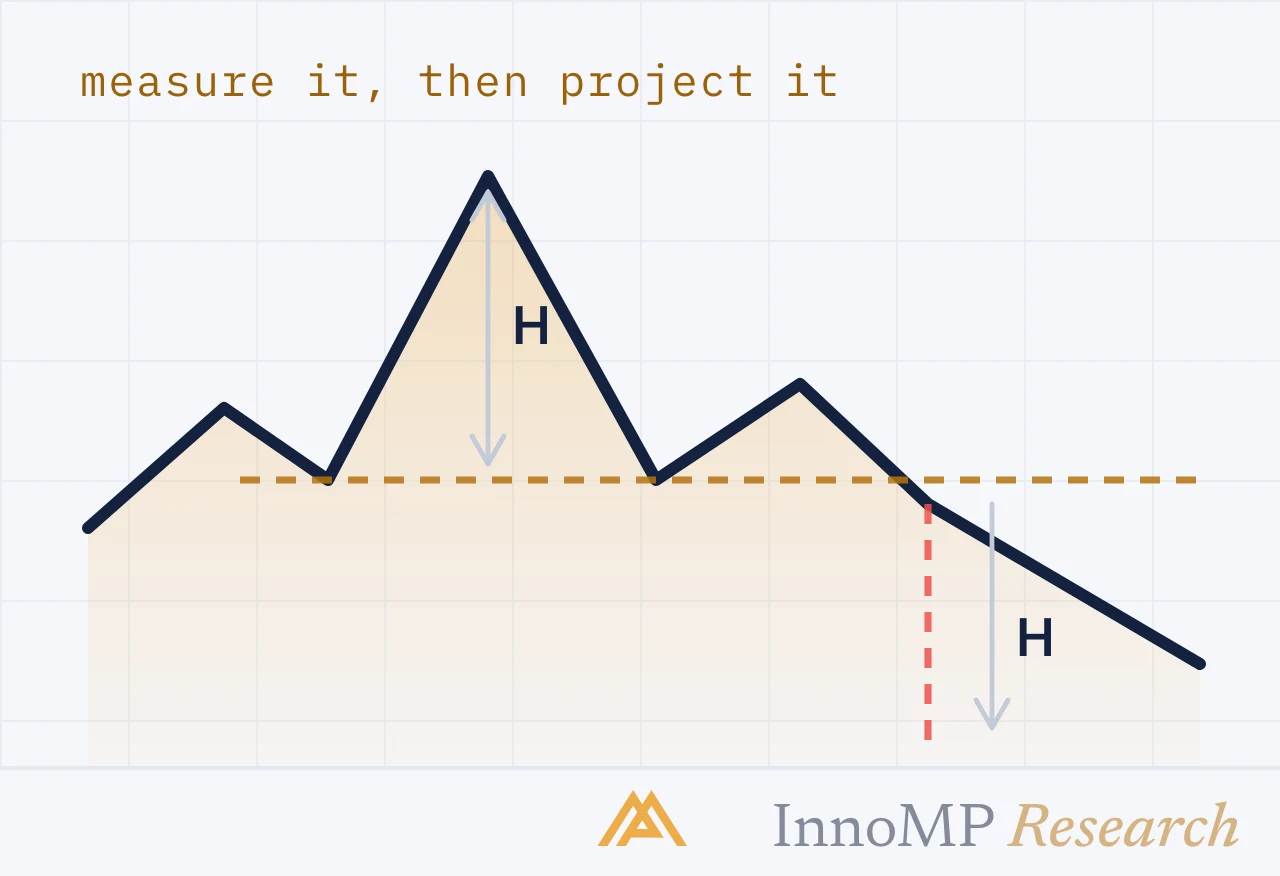
Chart patterns
A setup without a target is half a trade. How the measured move works, why targets must exist before entry, and what to do when the projection is unreachable.
Read more → 5 min read
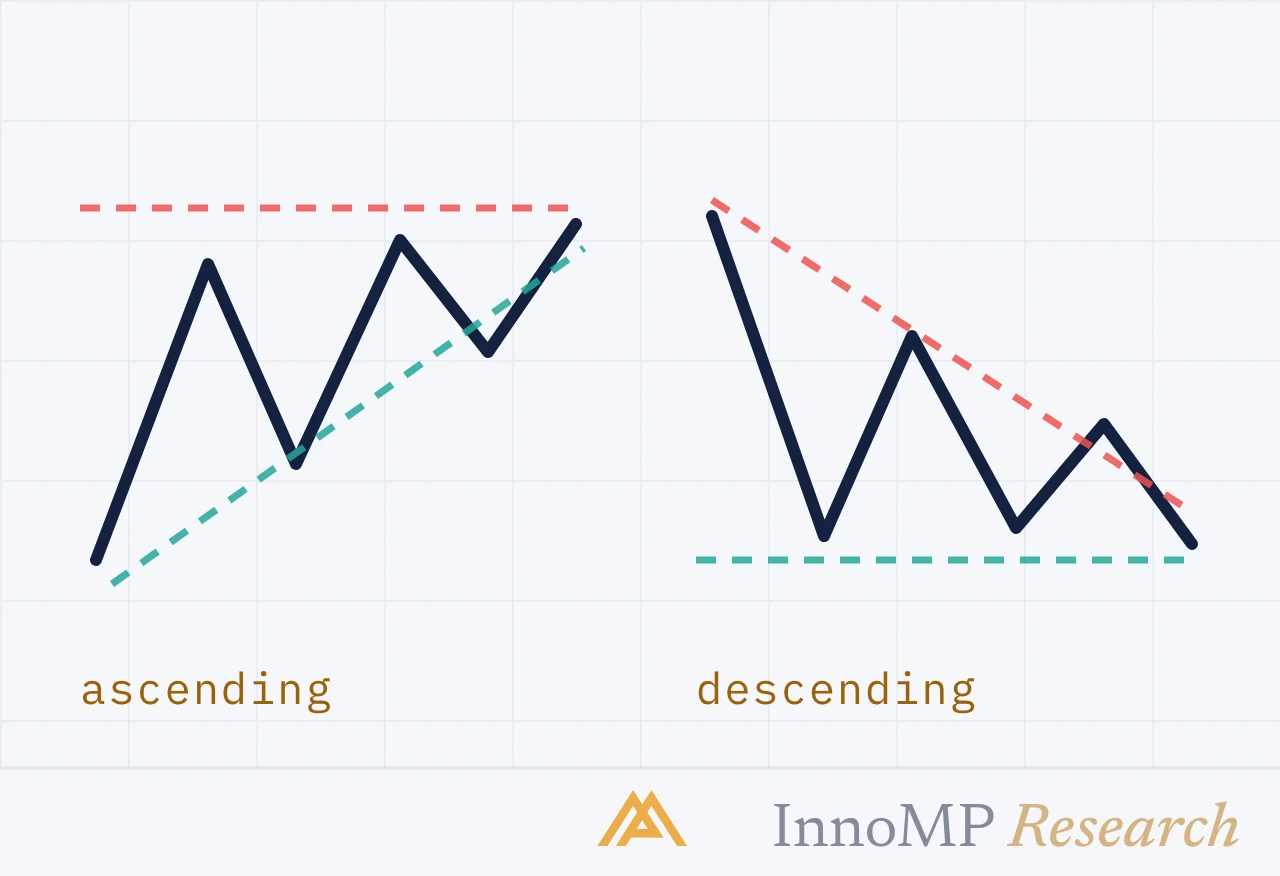
Chart patterns
Four shapes that all describe the same thing — a market narrowing toward a decision. What each one's slope tells you, and why the breakout direction is not as predetermined as textbooks suggest.
Read more → 5 min read
Market structureStop-lossIndicatorsCandlesticksTrendRisk-reward