Skip to content
Research / Education / Chart patterns

TA · Foundations · Part 14 of 20

Triangles, wedges and rectangles: patterns of compression

Four shapes that all describe the same thing — a market narrowing toward a decision. What each one's slope tells you, and why the breakout direction is not as predetermined as textbooks suggest.

InnoMP Research Published 30 Aug 2026 · Updated 02 Sept 2026 6 min read
In short

Triangles, wedges and rectangles are consolidation patterns formed by converging or parallel boundaries. An ascending triangle has a flat top and rising lows; a descending triangle has a flat bottom and falling highs; a symmetrical triangle narrows from both sides; a rectangle has parallel boundaries. All describe contracting or contained volatility, and all are traded on the break of a boundary rather than on the shape itself.

Triangles, wedges and rectangles are consolidation patterns defined by their boundaries. They are the multi-candle version of the compression covered in Part 12 — a market narrowing toward a decision.

Four shapes, distinguished only by the slope of their boundaries.

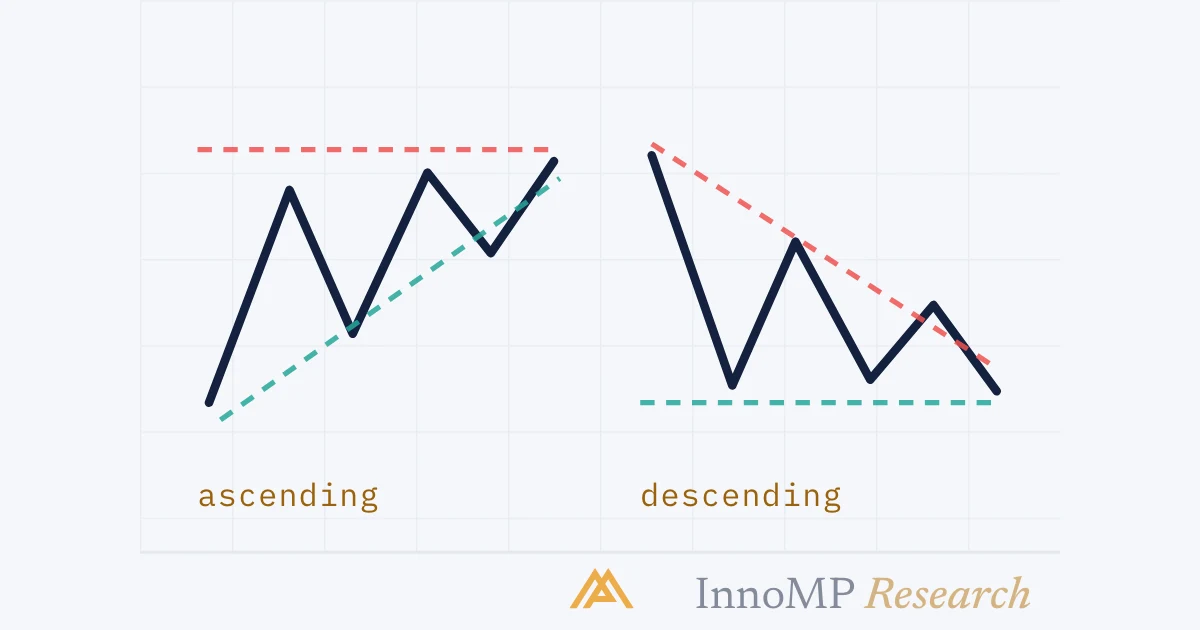
The two triangles

An ascending triangle and a descending triangle Two panels. The left shows a flat resistance line above with rising lows beneath it, labelled ascending. The right shows a flat support line below with falling highs above it, labelled descending. Ascendingflat toprising lowsDescendingflat bottomfalling highs InnoMP Research
One side advances, the other holds one fixed price. That asymmetry is what compresses the range.

Ascending triangle. Flat resistance above, rising lows below. Buyers pay progressively more each time; sellers defend one fixed price.

Descending triangle. Flat support below, falling highs above. The mirror.

Symmetrical triangles and rectangles

A symmetrical triangle and a rectangle Two panels. The left shows two boundaries converging toward each other from above and below with no directional tilt, labelled symmetrical. The right shows two parallel horizontal boundaries with price bouncing between them, labelled rectangle. Symmetricalno directional biasRectangleparallel — a range InnoMP Research
Neither side advancing: the symmetrical triangle simply narrows, and the rectangle does not narrow at all.

Symmetrical triangle. Both boundaries converge. Neither side is advancing on the other — the range simply narrows.

Rectangle. Parallel boundaries. A range, in the Part 4 sense, given a pattern name.

A rising wedge and a falling wedge Two panels. The left shows two upward-sloping boundaries converging as price rises, with a downward break marked. The right shows two downward-sloping converging boundaries with an upward break marked. Rising wedgetends to break downFalling wedgetends to break up InnoMP Research
Both boundaries tilt the same way while converging. The break usually goes against the tilt.

A wedge is a variant where both boundaries slope the same way while converging: a rising wedge tilts upward and tends to resolve down, a falling wedge tilts down and tends to resolve up.

The honest version of the textbook claim

Textbooks assign directional bias: ascending triangles break up, descending break down, rising wedges break down.

The reasoning is sound. In an ascending triangle, buyers are demonstrably willing to pay more each time while sellers hold one price — that asymmetry is genuine information, and it does tilt the odds.

But two cautions belong alongside it.

The bias is a tilt, not a rule. Ascending triangles break downward often enough that trading one before the break is speculation. The pattern tells you where the decision will happen, not what it will be.

Context outranks shape. An ascending triangle forming within a larger downtrend is a counter-trend setup regardless of its own bias. The higher-timeframe trend matters more than the pattern’s internal geometry.

The practical stance: use the shape to identify where the break will occur and to prepare both directions, then trade whichever happens.

Time inside the pattern

Boundaries converge toward an apex. Where price sits within that convergence matters.

A break in the middle of a triangle compared with a break at the apex Two converging-boundary patterns. In the first, price breaks out around the middle of the convergence with a large candle. In the second, price drifts all the way into the apex and the eventual break is small and weak. Mid-patternenergy still storedInto the apexparticipants drifted away InnoMP Research
Compression stores energy only while participants stay engaged. Drift all the way to the apex and there is nothing left to release.

Most patterns resolve in roughly the middle-to-late portion of their range — after enough compression to build energy, before the boundaries meet. A pattern that drifts all the way into the apex has typically exhausted itself, and the eventual break tends to lack force.

The reason is participation. Compression works because positions accumulate while nobody forces the issue. If compression continues long enough, participants lose interest and drift away — and there is no accumulated imbalance left to release.

Key takeaway These patterns are most valuable for what they tell you about timing, not direction. A market in a tightening triangle is a market approaching a decision on a roughly known schedule — which is exactly the situation to set a Market Watcher alert on both boundaries and stop watching.

Trading the break

Everything from breakouts and false breakouts applies directly, because that is what this is.

Wait for a close beyond the boundary, not a wick. Prefer breaks in the direction of the higher-timeframe trend. Expect false breaks, particularly in symmetrical triangles where both boundaries are heavily watched. Consider the retest for a tighter stop and better ratio.

A stop at the opposite boundary of a narrow triangle, with and without a buffer A triangle with an entry on the upper break. One stop sits exactly on the lower boundary and is shown being hit by a wick. A second stop sits slightly beyond it with a buffer and survives the same wick. entrystop on the boundary — hitstop with buffer — survives InnoMP Research
The narrow range gives a close stop, which is the appeal. It also puts that stop inside a heavily watched area — hence the buffer.

One addition specific to compression patterns: because the range has narrowed, the stop can sit relatively close — often the opposite boundary. That produces a favourable position size, which is part of why these setups are popular. But it also means the stop sits inside a well-watched area, so a buffer matters.

Next: Measuring moves from patterns — how to turn any of these into a target.

Key facts
  • An ascending triangle has a horizontal resistance level and a rising support line.
  • A descending triangle has a horizontal support level and a falling resistance line.
  • A symmetrical triangle converges from both sides and carries no directional bias on its own.
  • Compression patterns precede expansion, but do not reliably predict the direction of it.
Frequently asked questions

What is an ascending triangle?

A pattern with a horizontal resistance level above and a rising trendline of higher lows below. Buyers are willing to pay progressively more while sellers defend one fixed price, which compresses the range until one side gives way.

Which way does a symmetrical triangle break?

It carries no inherent bias — both boundaries are converging equally. The usual approach is to trade the break in whichever direction it occurs, or to favour the direction of the larger trend the triangle formed within.

What is the difference between a wedge and a triangle?

A wedge has both boundaries sloping in the same direction while converging; a triangle has one flat boundary or two boundaries sloping toward each other. A rising wedge slopes up and often resolves downward; a falling wedge slopes down and often resolves upward.

How long should a consolidation pattern take to break out?

Most resolve before price reaches the apex where the boundaries would meet. A pattern that drifts all the way into the apex has lost its energy, and the eventual break tends to be weaker.

InnoMP Research

Market research, trading education and platform guides from the InnoMP research desk — covering forex, metals, indices and stock CFDs.

Published 30 Aug 2026 · Updated 02 Sept 2026 · Reviewed by InnoMP Compliance

Disclaimer: This content is provided for general informational purposes only and does not constitute investment advice, an offer, or a solicitation to buy or sell any financial instrument. It has been prepared without regard to your individual financial circumstances or objectives. Trading CFDs involves a high risk of loss.

Related notes

Trading emotions

FOMO: chasing the move you already missed

The setup came and went without you. Then price runs, and entering late feels urgent. Why chased entries carry the worst risk-reward on the chart.

5 min read