Skip to content
Research / Education / Chart patterns

TA · Foundations · Part 15 of 20

Measuring moves: turning a pattern into a target

A setup without a target is half a trade. How the measured move works, why targets must exist before entry, and what to do when the projection is unreachable.

InnoMP Research Published 30 Aug 2026 · Updated 02 Sept 2026 6 min read
In short

A measured move projects a pattern's height from its breakout point to estimate a target. For a head and shoulders, measure from the head to the neckline and project that distance down from the break. For a rectangle or triangle, measure the widest part and project it from the break. The target matters because it converts a setup into a risk-reward ratio that can be judged before entry.

A measured move projects a pattern’s height from its breakout point. It is the standard way to turn a chart pattern into a number.

Its real function is not prediction. It is that a target existing before entry makes the risk-reward ratio computable — and a trade whose ratio cannot be computed before entry cannot be judged.

The method

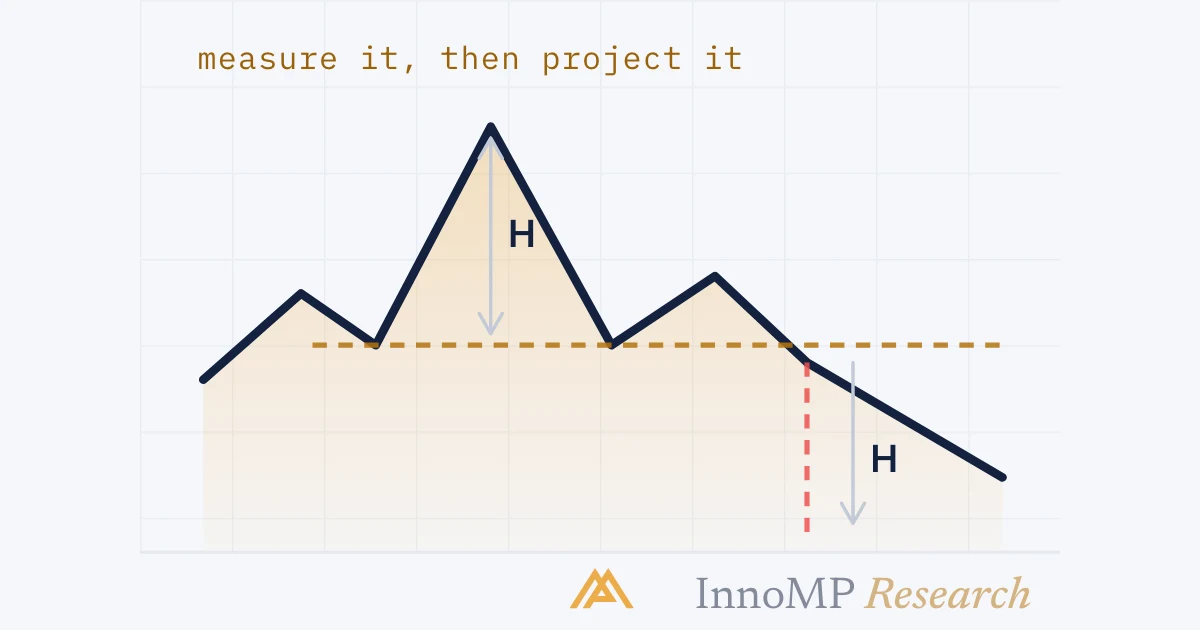
A measured move projected from a head and shoulders neckline break A head and shoulders pattern with a vertical measurement arrow from the head down to the neckline labelled H, and an identical vertical distance projected downward from the neckline break point to a horizontal target line. necklineHbreakproject Htarget InnoMP Research
Measure the height, project it from the break. The same two steps apply to every pattern in this series.

Head and shoulders. Measure vertically from the head to the neckline. Project that distance downward from the point where price broke the neckline.

Double top or bottom. Measure from the peaks to the trough. Project from the break.

Measuring a rectangle and a triangle Two panels. The left shows a rectangle with a vertical arrow spanning its height and the same distance projected above the break. The right shows a triangle with a vertical arrow across its widest part, the base, projected from its break. HRectanglerange heightbaseTrianglewidest part InnoMP Research
Rectangle: the range height. Triangle: the base, its widest part. Both project from the point price left the pattern.

Rectangle. Measure the height of the range. Project from the break.

Triangle. Measure the widest part — the base — and project from the break.

In every case the logic is the same: the pattern’s own dimensions estimate the energy stored inside it. A tall pattern took a large range to build and projects a large move; a small one projects a small one.

Where projections break down

A projection that requires price to pass through an established support level A measured move projection extending downward from a break, with a shaded support band sitting between the break point and the projected target. The band is labelled a level that has held before. breakheld three times beforeprojected targetTwo assumptionsthe break works,and the level fails InnoMP Research
Reaching the projection means assuming that level fails — a second assumption on top of the first. The honest target is the level.

A structural level in the path. If the projection requires price to pass through a well-established support level, you are assuming that level fails — a second assumption stacked on the first. The honest target is the level, not the projection.

Overextended patterns. A pattern that forms after an enormous move has less room ahead of it than one forming at the start of a trend.

Thin liquidity. Projections assume orderly movement. Around scheduled news or weekend gaps, price can overshoot or undershoot dramatically.

The practical rule: take the nearer of the measured move and the next major structural level. Being conservative on targets costs some upside; being optimistic costs entire trades that reached 80% of a projection and reversed.

The decision the target enables

Here is where measuring earns its place. Suppose a double top gives:

  • Entry on the break: 1.0850
  • Stop above the second peak: 1.0895 — 45 pips of risk
  • Measured target: 1.0770 — 80 pips of reward
The same setup judged with and without a support level in the path Two horizontal bar comparisons. The first shows 45 pips of risk against 80 pips of reward, marked take it. The second shows the same 45 pips of risk against only 30 pips of realistic reward because a level blocks the path, marked skip it. Clear path45 risk80 reward→ 1:1.8 · worth takingLevel at 1.082045 risk30 reward→ below 1:1 · skip InnoMP Research
Same pattern, same entry, same stop. One number changed and the trade became one to pass on.

That is a ratio of roughly 1:1.8. Whether that is acceptable depends on your win rate, per the table in risk-reward ratio — but the point is that you can decide before entering.

Now change one input. If a strong support level sits at 1.0820, the realistic target is 30 pips against 45 of risk: a ratio below 1:1. Same pattern, same entry, and now a trade worth skipping.

Key takeaway The measured move’s job is to let you say no. A setup that looks excellent but projects a poor ratio is a setup to pass on — and passing is only possible if the target was calculated before the entry rather than after.

Managing toward it

Three ways of managing a position toward a measured target Three rows sharing an entry and a target line. The first exits fully at the target. The second exits half at the target and trails the remainder higher. The third trails a stop from the start and exits when the trail is hit. measured targetFull exitsimple, mechanicalHalf, then trailbanks it, keeps upsideTrail throughoutbest on runners, gives back at the top InnoMP Research
None dominates. Pick one in advance so your journal measures a single method rather than a mix of improvisations.

Take it in full. Simple, mechanical, easy to follow. Gives up the occasional large runner.

Partial at the target, trail the rest. Banks the estimate and keeps exposure to a bigger move. Costs a lower average exit on the trades that would have run furthest.

Trail from the start. Captures large moves best, gives back more on the ones that stall near target.

None dominates. What matters is choosing one in advance and applying it consistently, so that your journal — in R-multiples — measures a single method rather than a mix of improvisations.

Next: Moving averages — the first of the five indicator parts.

Key facts
  • A measured move projects the pattern's own height from the breakout point.
  • Targets must be set before entry, since their purpose is to judge whether the trade is worth taking.
  • A projection that lands beyond a major structural level is unlikely to be reached in full.
  • If the measured move gives a poor risk-reward ratio, the correct response is to skip the trade.
Frequently asked questions

How do you calculate a measured move target?

Measure the pattern's height in price terms — head to neckline, or the widest part of a rectangle or triangle — then project that same distance from the point where price broke out. The result is an estimate of how far the resolution may travel.

Are measured move targets reliable?

They are estimates, not forecasts. Their value is that they exist before entry, allowing the risk-reward ratio to be judged. Many moves fall short of the projection and some greatly exceed it.

What if the target is blocked by a support or resistance level?

Treat the structural level as the realistic target rather than the projection. A measured move that requires price to pass through a major level assumes that level will not hold, which is a second assumption stacked on the first.

Should I take partial profits at the target?

Many traders reduce at the measured move and let the remainder run with a trailing stop. This banks the estimate while keeping exposure to a larger move — but it also lowers average exit price on the trades that would have run furthest.

InnoMP Research

Market research, trading education and platform guides from the InnoMP research desk — covering forex, metals, indices and stock CFDs.

Published 30 Aug 2026 · Updated 02 Sept 2026 · Reviewed by InnoMP Compliance

Disclaimer: This content is provided for general informational purposes only and does not constitute investment advice, an offer, or a solicitation to buy or sell any financial instrument. It has been prepared without regard to your individual financial circumstances or objectives. Trading CFDs involves a high risk of loss.

Related notes