Tagged “Support & resistance”
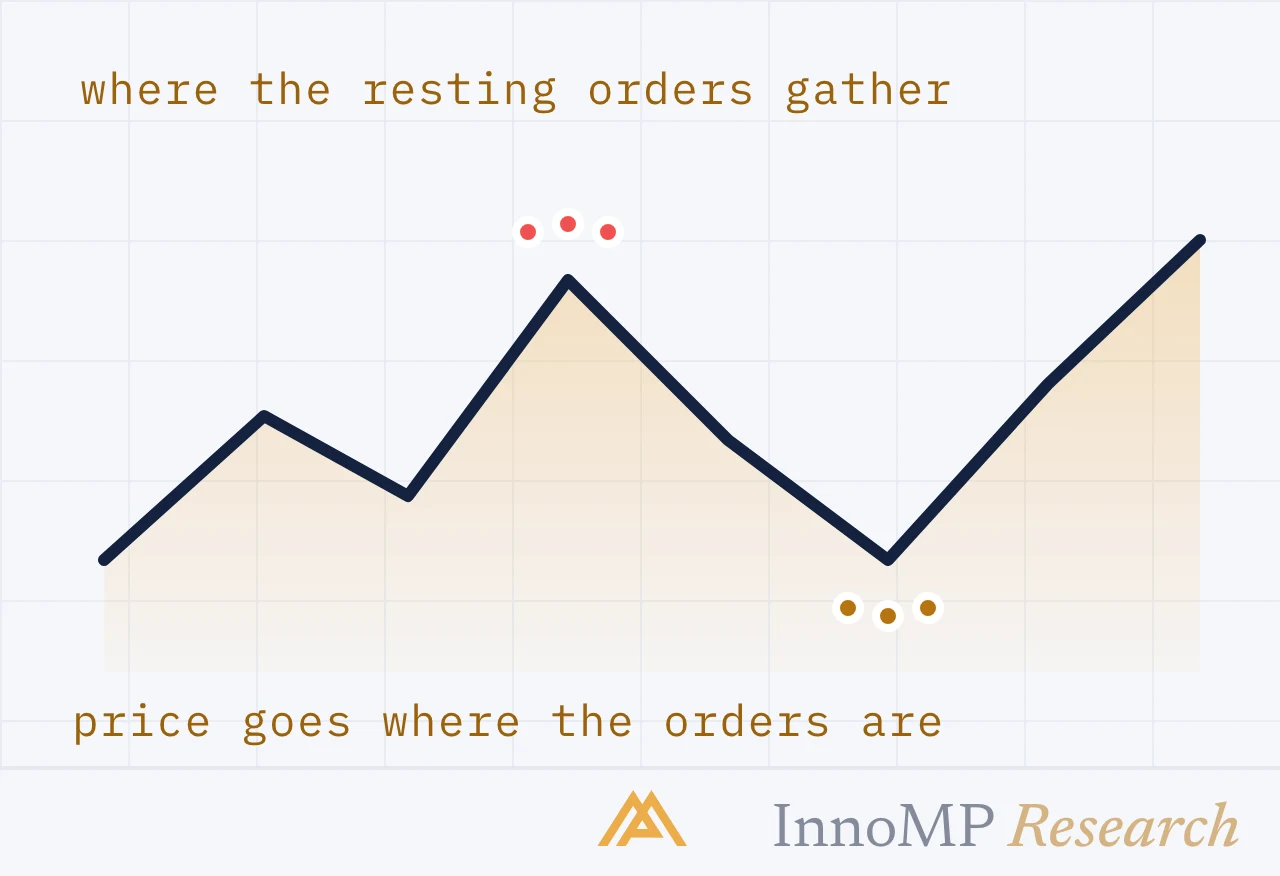
Market structure
Liquidity is resting orders, and resting orders are not spread evenly. They gather beyond swing points, at round numbers and reference levels, and on the far side of obvious lines. Why price is drawn to those places.
Read more → 8 min read
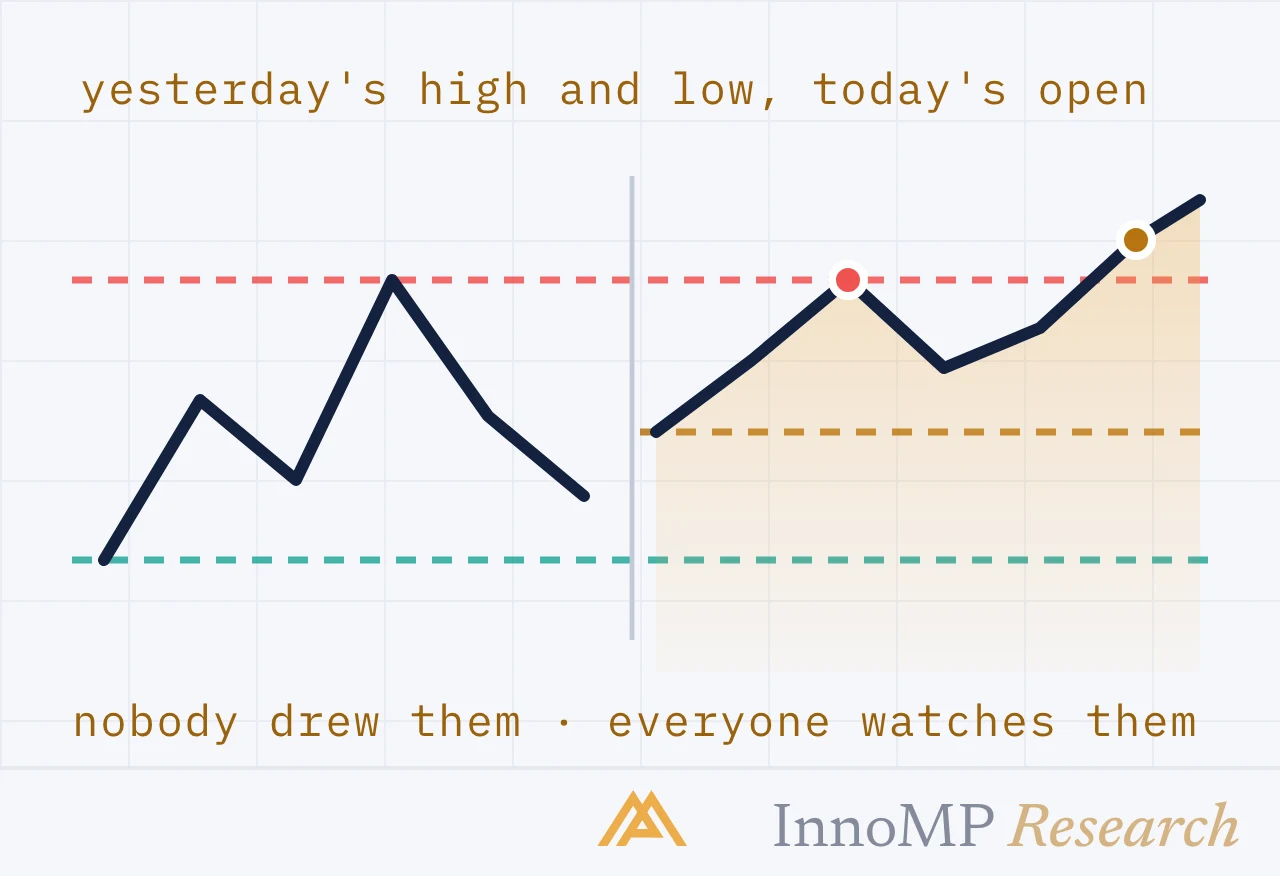
Support & resistance
Every day leaves levels behind that thousands of screens watch: the previous day's high and low, the daily and weekly open, each session's extremes. Why they behave like support and resistance, and how to rank them.
Read more → 8 min read
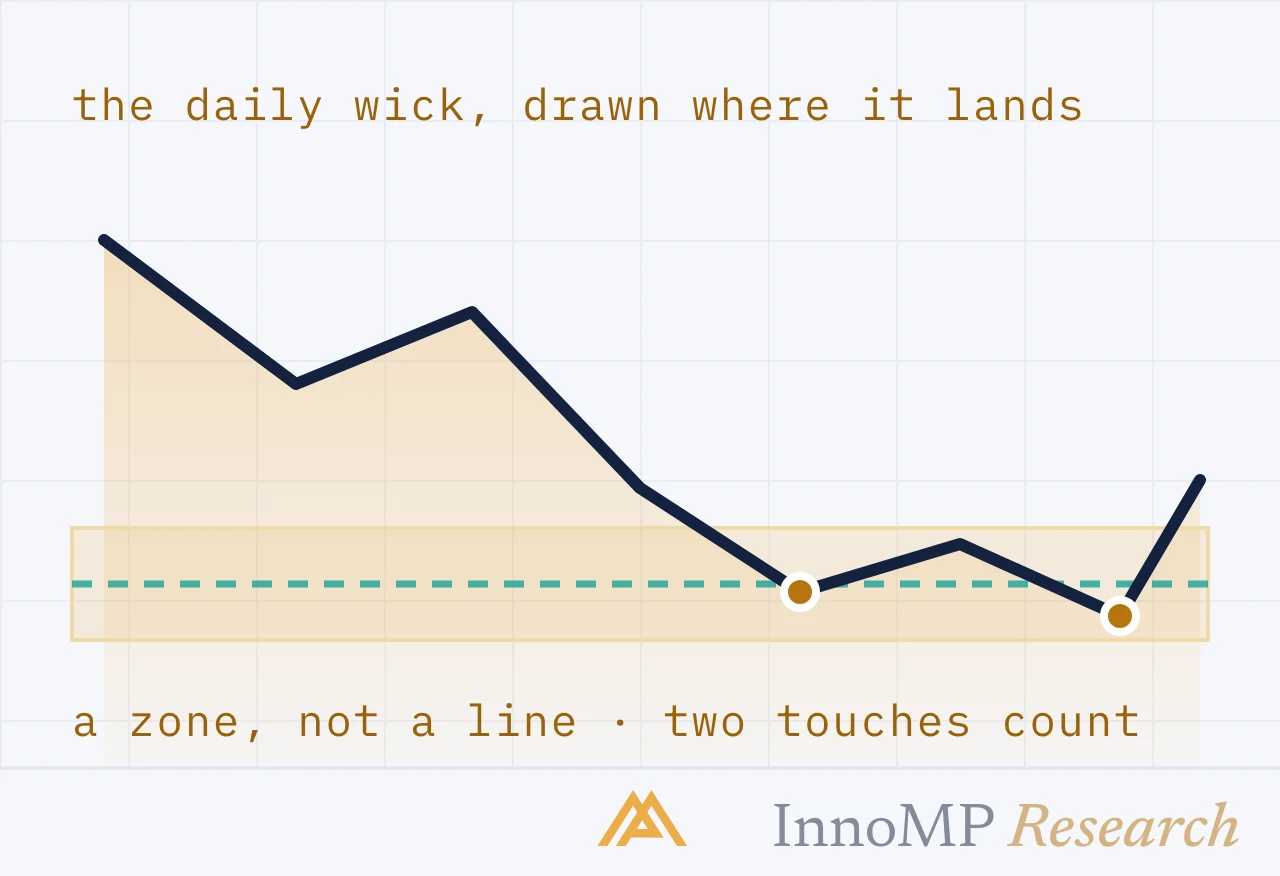
Support & resistance
Which levels from the daily chart deserve a place on the chart you trade, why they become zones rather than lines when they get there, and what a real reaction at one looks like.
Read more → 8 min read
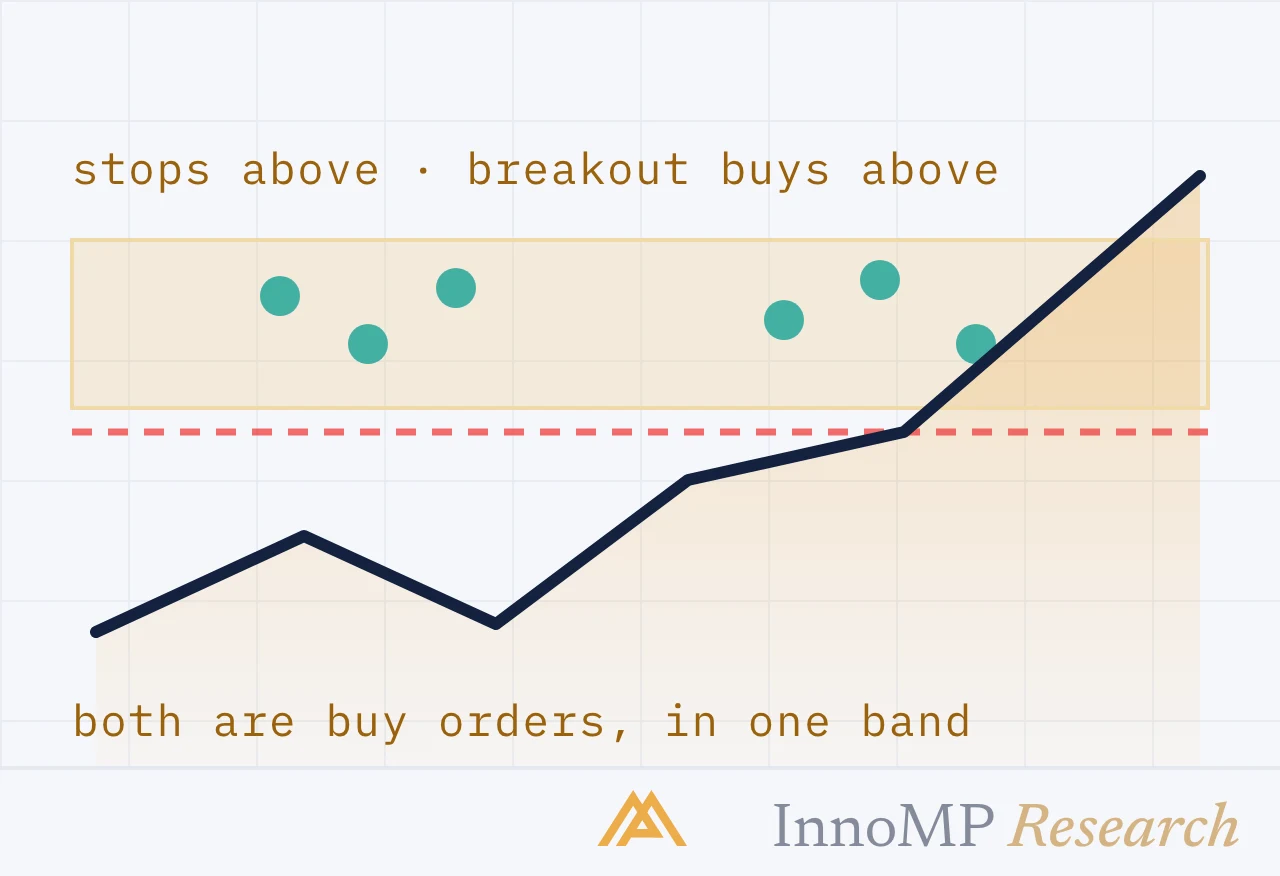
Market structure
The break of a level is the most-watched event on any chart and the least reliable. What separates a break that holds from one that traps you.
Read more → 5 min read
Support & resistance
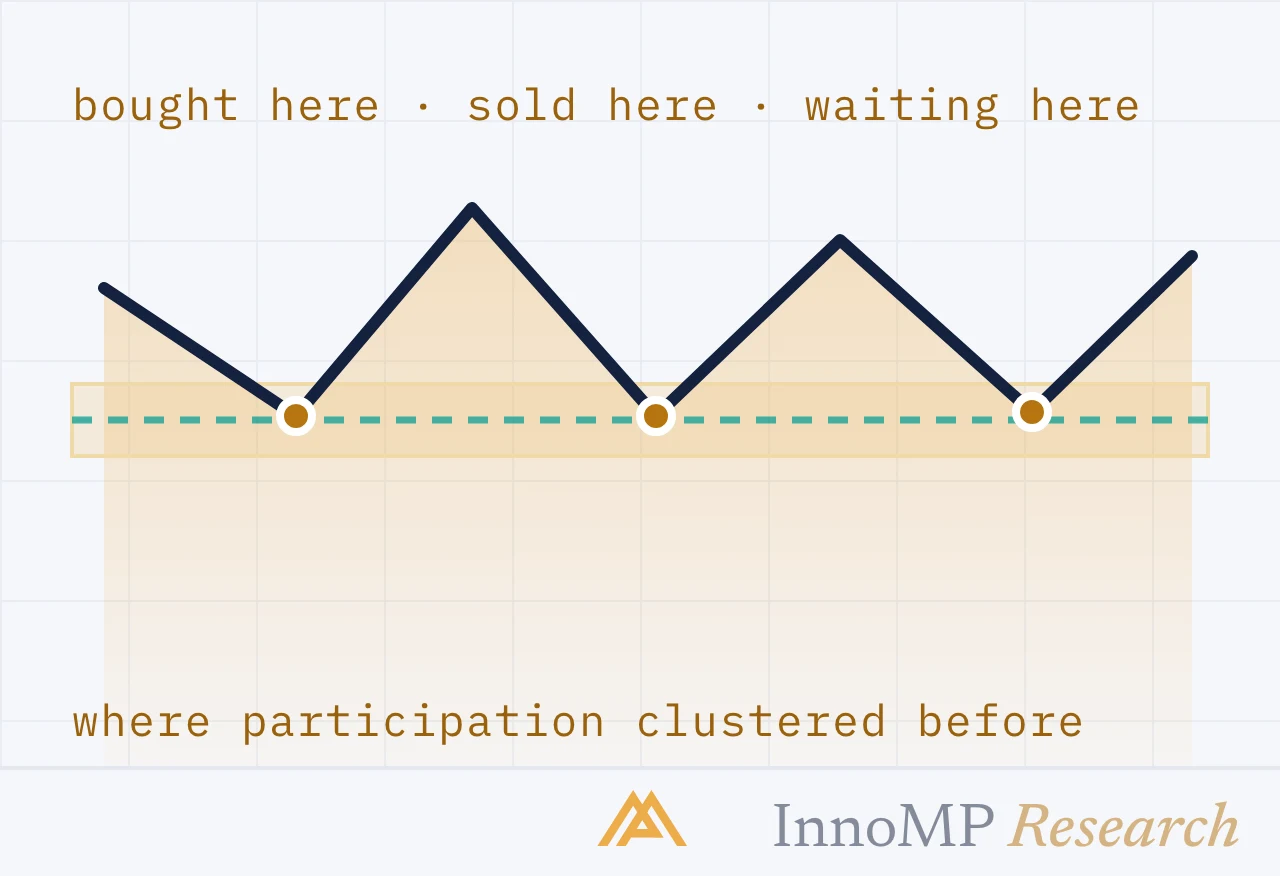
The most useful lines on any chart, and the most commonly drawn wrong. What these levels actually are, how to draw them as zones, and why a broken support becomes resistance.
Read more → 6 min read

Support & resistance
A trendline is support and resistance that moves. This guide shows how to draw one that is defensible, why two touches are not enough, and what a channel adds.
Read more → 5 min read
Market structureStop-lossMarket hoursBeginnerTrend