Technical analysis is the study of price charts to judge what is more likely to happen next. Instead of asking what something is worth, it asks where buyers and sellers have already acted, and where they are likely to act again. It gives you probabilities and a clear point at which you were wrong — never certainty.
Technical analysis is the study of price charts to judge what is more likely to happen next.
That sentence hides how simple the underlying idea is, so let us start further back than most guides do.
Start here: what a chart actually is
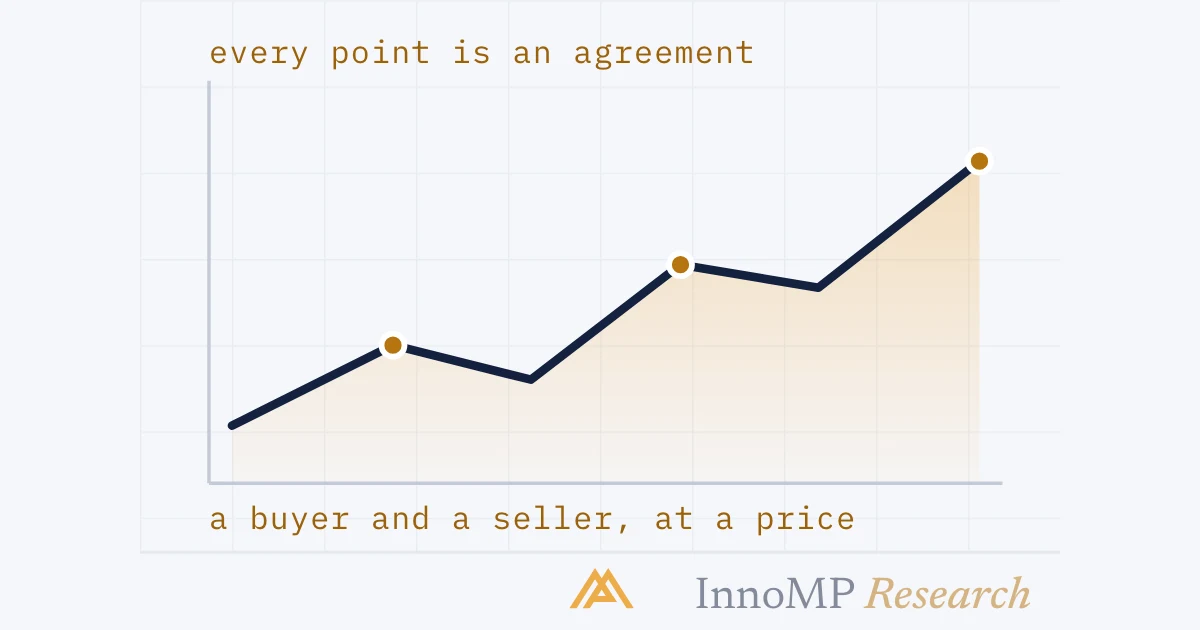
Every price you see on a chart happened because someone bought and someone sold at that price. A chart is not a prediction or an opinion. It is a receipt — a record of transactions that already took place, arranged in time order.
That is the whole foundation. Price on the vertical axis, time on the horizontal axis, and every point a moment when a buyer and a seller agreed.
What technical analysis asks
There are two big ways to analyse a market.
Fundamental analysis asks what is this worth? It studies interest rates, company earnings, supply and demand — the forces that should determine a fair price.
Technical analysis asks a narrower question: what have buyers and sellers actually done, and where are they likely to act again? It takes the chart as the summary of everything the market currently believes.
Neither is better. Many traders use both — fundamentals to decide what to trade, technicals to decide when.
The three ideas it rests on
Technical analysis assumes three things. Each is reasonable; none is a law of nature.
1 · The price already reflects what is known. Whatever is public — rates, news, sentiment — is already in the price, because everyone who cared has already traded on it. You do not need to out-research the market to trade it. You need to read what it has already decided.
2 · Prices move in trends. Movement is not purely random. It clusters into runs in one direction, separated by periods of going sideways. Whether this is strictly true is debated by academics; that trend-following has been used for over a century suggests it is at least usable.
3 · Behaviour repeats. Not prices — behaviour. The same nervousness at the same kind of price level produces the same shape on a chart, because the participants are human and their incentives are stable.
An example you can follow
Here is technical analysis in its simplest useful form.
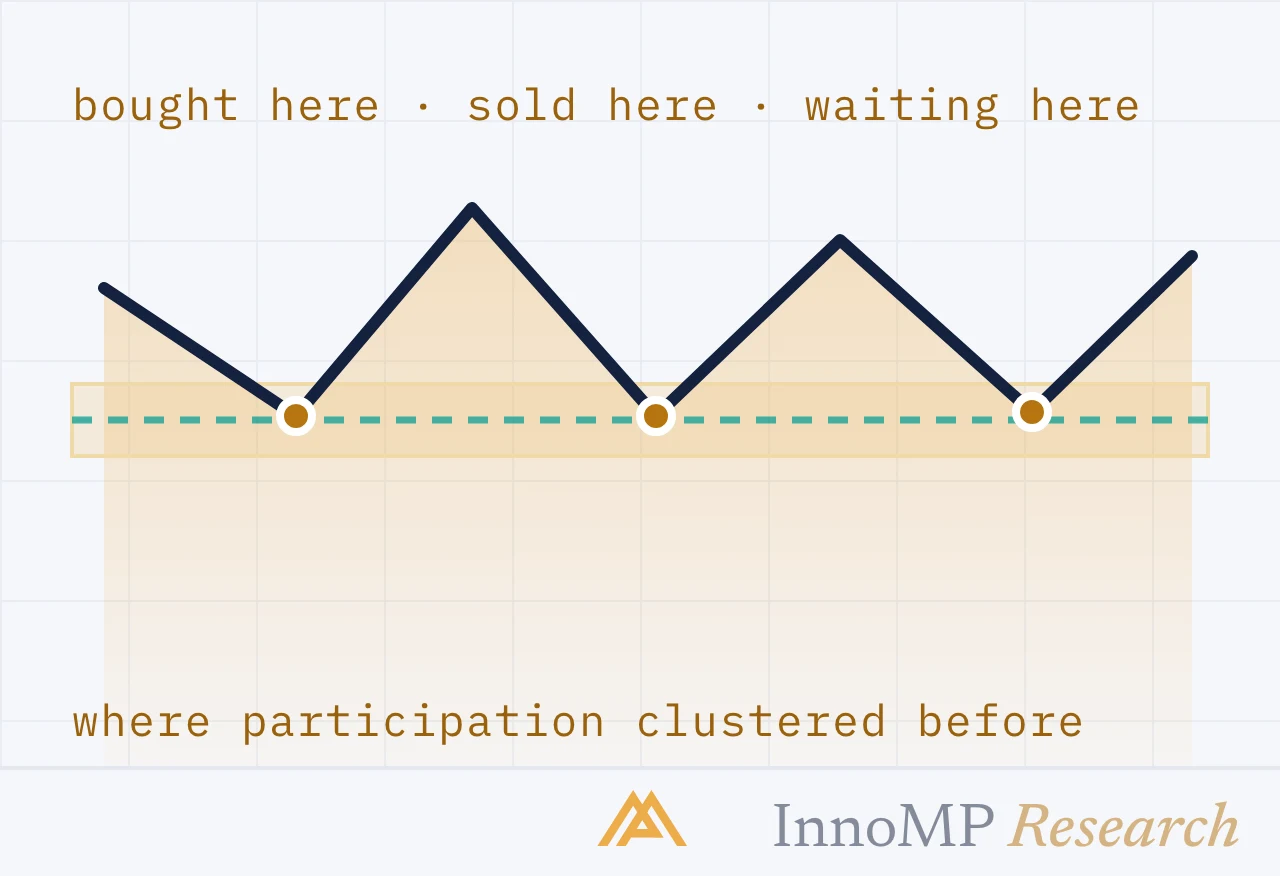
Suppose a price falls to 1.0800 three separate times over a few weeks, and each time it bounces back up. A technical analyst does not claim 1.0800 is “fair value.” They observe something narrower and more useful:
Enough buyers appeared at 1.0800 to stop the fall — three times. If price returns there, buyers may appear again.
That is not a prediction. It is a statement about where participation has clustered, plus a clear condition: if price drops well below 1.0800 and stays there, the observation was wrong.
The most important sentence in this course Technical analysis does not tell you what will happen. It tells you what is more likely, and — far more usefully — exactly where you would be proven wrong. That second half is what makes a trade possible to size and survive.
What it is not
Three misunderstandings cause most beginner losses.
It is not fortune telling. A chart pattern does not say what will happen. It describes a situation that has formed and what has tended to follow. Every setup needs a point where you accept the idea failed — a stop-loss.
It is not a substitute for managing risk. The best read in the world loses money at the wrong trade size. Analysis picks the trade; position sizing decides whether you survive being wrong. If you read only one other article, read that one.
It is not a pile of indicators. Beginners often stack six indicators looking for agreement. Most indicators are recalculations of the same price data, so their agreement means far less than it looks. We cover indicators in Parts 16–20 — deliberately last.
Why it suits CFD trading
Technical analysis needs one thing: a market with a continuously quoted price. CFDs provide exactly that across forex, metals, indices and stock CFDs — the instruments on InnoMP — with the same chart tools working on all of them.
Two features of leveraged trading make good analysis matter more here:
- Leverage shortens the time you have to be wrong. Someone holding an asset outright can wait out a bad move. A leveraged position meets margin limits first, so analysis that defines the failure point precisely is worth more.
- Holding costs accumulate. Spread and overnight financing mean a position needs to work within a reasonable time, which favours setups with defined risk and defined timeframes.
How to use this course
This is Level 1 of 3. Foundations covers everything you need to read a chart and describe what it shows. The Intermediate level puts those pieces together into a procedure, and the Professional level goes underneath the price and judges the record.
The honest promise of this level is not that you will predict markets afterwards. It is that you will be able to look at a chart, say specifically what is happening, and state the price at which your description would be wrong.
That is what technical analysis actually offers — and combined with careful position sizing, it is enough to work with.
Next: Reading price charts — the three chart types and what each one hides.
- Technical analysis studies price and volume; fundamental analysis studies the underlying economics.
- Its three classical assumptions are: price reflects available information, price moves in trends, and behaviour repeats.
- It produces probabilities, not predictions — no chart pattern has a fixed success rate.
- It works on any market with a continuously quoted price: forex, metals, indices and stock CFDs.