Skip to content
Research / Education / Cognitive bias

Trading Psychology · Part 3 of 20

Confirmation bias: finding the chart that agrees with you

Once you have a view, evidence stops being evidence. How the bias operates in chart analysis specifically, and the practical tests that catch it.

InnoMP Research Published 31 Aug 2026 · Updated 31 Aug 2026 6 min read
In short

Confirmation bias is the tendency to seek and weight information that supports an existing view while discounting information that contradicts it. In trading it appears as switching timeframes until one agrees, adding indicators until one confirms, and interpreting ambiguous price action in the direction of an existing position. The main defence is defining invalidation before entry.

Confirmation bias is the tendency to seek and weight evidence that supports what you already believe. It is not stupidity and it does not feel like bias — it feels like doing more research.

In trading it has a particularly convenient home, because a chart can be rendered dozens of ways and one of them will agree with you.

Timeframe shopping

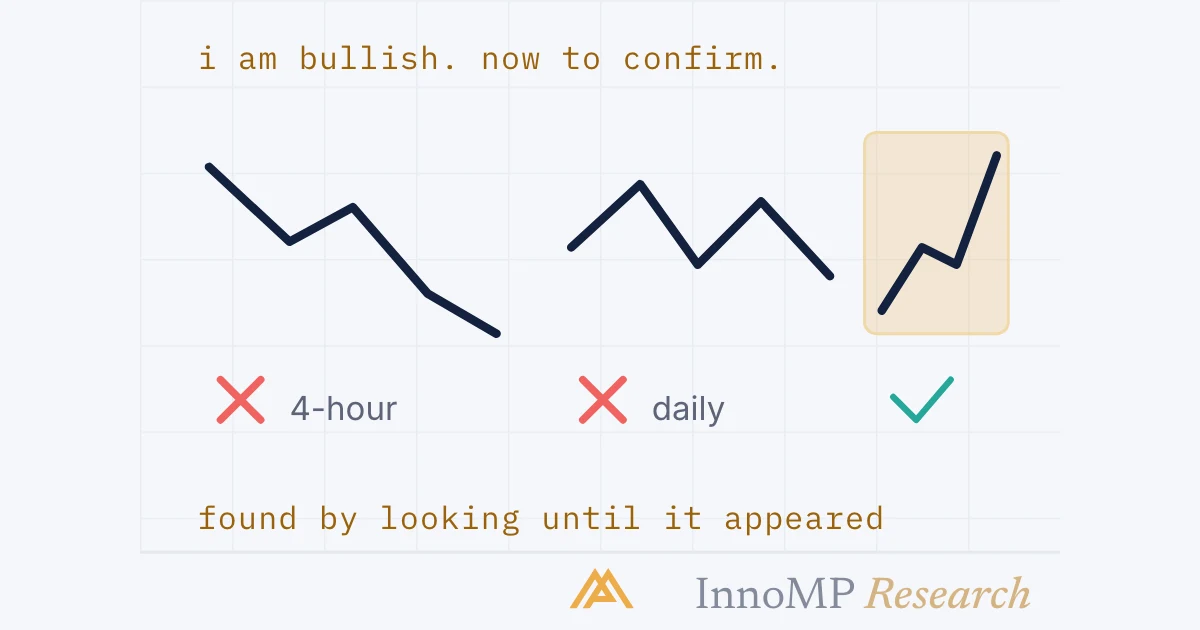
Checking timeframes in sequence until one agrees Three timeframe panels checked in order. The four-hour looks bearish and is rejected, the daily is unclear and is rejected, the weekly shows an uptrend and is kept, marked found it. I am bullish. Now to confirm.4-hourbearish ✗Dailyunclear ✗Weeklyuptrend ✓“higher timeframe confirmation”— found by looking until it appeared InnoMP Research
The tell is sequence. Choosing timeframes before forming a view is analysis; choosing them after is shopping.

You are bullish. The 4-hour chart looks bearish. So you check the daily — also unclear. The weekly — there it is, an uptrend. You now have “higher timeframe confirmation,” and you have it because you kept looking until you found it.

Indicator stacking

Adding indicators until one agrees with the position Three indicator panels stacked. RSI disagrees and is marked with a cross, MACD is ambiguous and marked with a question, stochastics agrees and is marked with a tick and highlighted. Position: longRSIMACD?Stochasticthree views of one price series InnoMP Research
These are transformations of the same price data. With enough of them, one will agree by construction.

RSI disagrees, so you add MACD. It is ambiguous, so you add stochastics. As Part 20 of the technical analysis series shows, these are transformations of the same price data.

Reading ambiguity directionally

The same ambiguous price action annotated by a long and a short One identical price pattern shown twice. On the left it is annotated with higher lows and buyers absorbing. On the right the identical pattern is annotated with lower highs and repeated rejection. Held longhigher lowhigher low againbuyers absorbingHeld shortrejectedrejected againfailing to advance InnoMP Research
Identical data. Neither reader is lying — both are resolving ambiguity in the direction of their position.

A candle with long wicks both sides is genuine indecision. A trader who is long reads it as absorption; a trader who is short reads it as rejection. Same candle, and both are certain they are reading it neutrally.

Why it intensifies after entry

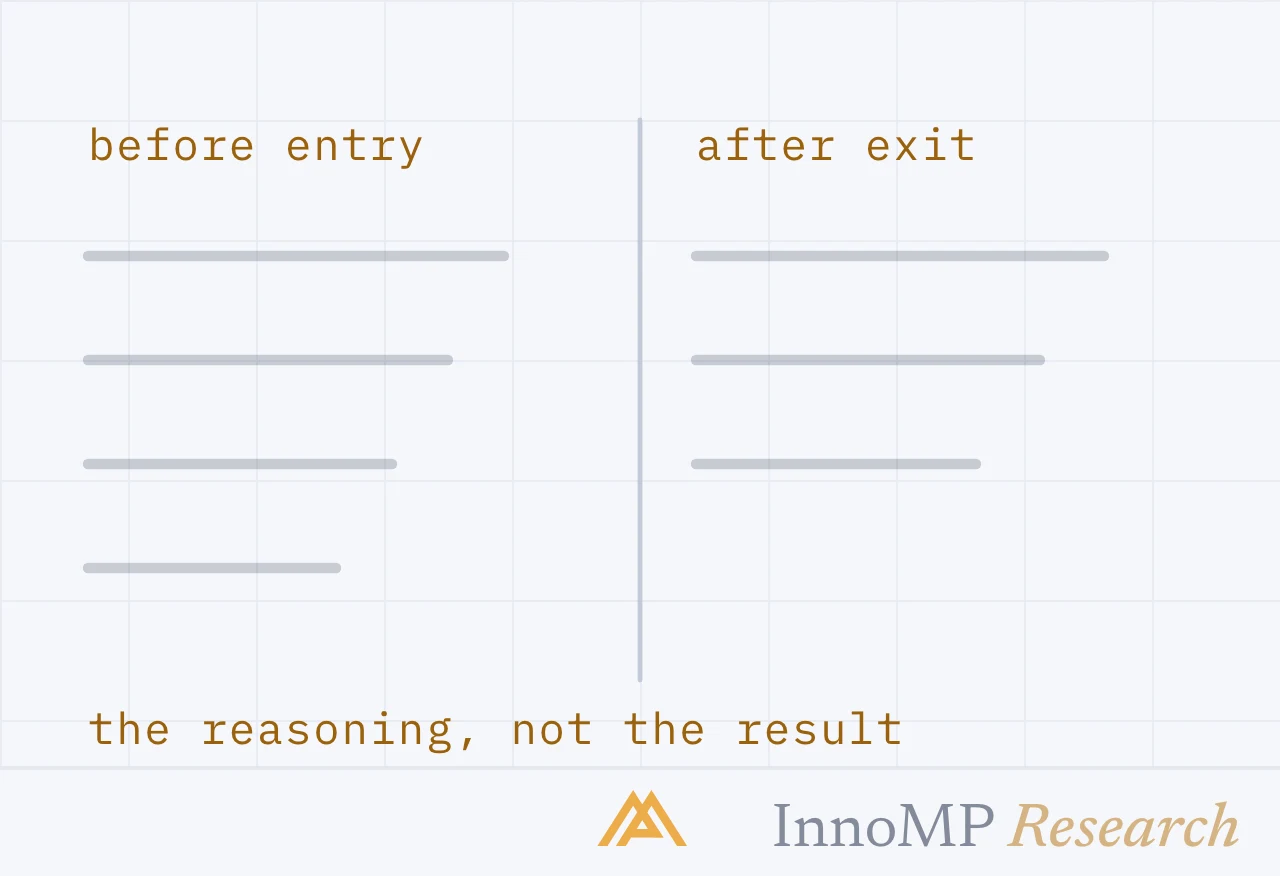
Before a trade, a view is a hypothesis. After entry it is a position — and disconfirming evidence is now also evidence that you made a mistake and are losing money.

How readily disconfirming evidence is accepted before and after entry A descending line showing willingness to accept contrary evidence. It is high before entry, drops sharply at the entry marker, and falls further as the position moves into loss, with a note that each contrary signal is reabsorbed as noise. willing to accept contrary evidenceentrya hypothesisnow also evidencethat you are losing money”noise before the reversal” InnoMP Research
The cost of accepting the evidence rises with the position's loss — and so does the incentive to reinterpret it.

That raises the cost of accepting it, which raises the incentive to reinterpret it. This is why traders who were balanced during analysis become remarkably one-sided ten minutes after entering — and it is the pathway from a planned 1% loss to an unplanned 4% one.

The tests that catch it

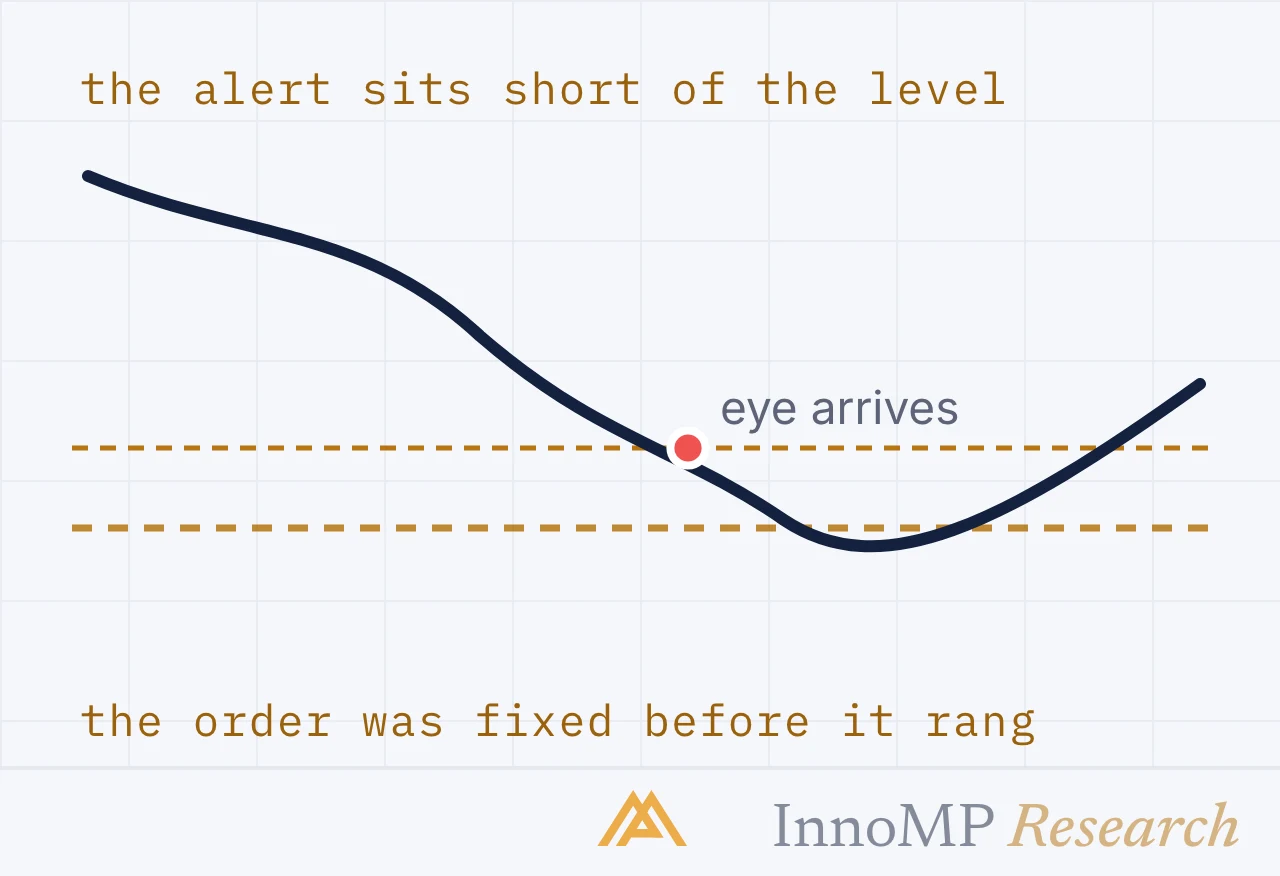
Write the invalidation before entry. One sentence: “This idea is wrong if price closes below 1.0840.” Specific, in advance, in writing. Now disconfirmation has a defined form and cannot be reinterpreted, which is exactly what stop placement is for.

Fix your tools first. Decide which timeframes and indicators you use before looking at the instrument. Consulting anything outside that set mid-analysis is shopping.

State the opposing case out loud. Before entering, write the best argument against the trade. If you cannot construct one, you have not looked. This takes ninety seconds.

Apply the reversal test. If price were exactly here and you had no position, would you take the opposite trade? A yes on a position you are holding is a strong signal.

Key takeaway Confirmation bias cannot be removed by trying to be objective, because it operates before the part of you that tries. What works is committing to a falsifiable statement in advance — a price at which you are wrong — and then treating that price as binding rather than as one input among many.

Four tests that catch confirmation bias before entry Four rows: write the invalidation as one sentence, fix your tools before looking at the instrument, state the best case against the trade, and apply the reversal test of whether you would take the opposite side with no position. Write the invalidation”wrong if price closes below 1.0840”Fix your tools firstanything consulted later is shoppingState the case againstninety seconds · if you cannot, you did not lookThe reversal testwould I take the opposite side flat? InnoMP Research
All four run before entry, which is the only point at which they can be answered honestly.

The journal’s role

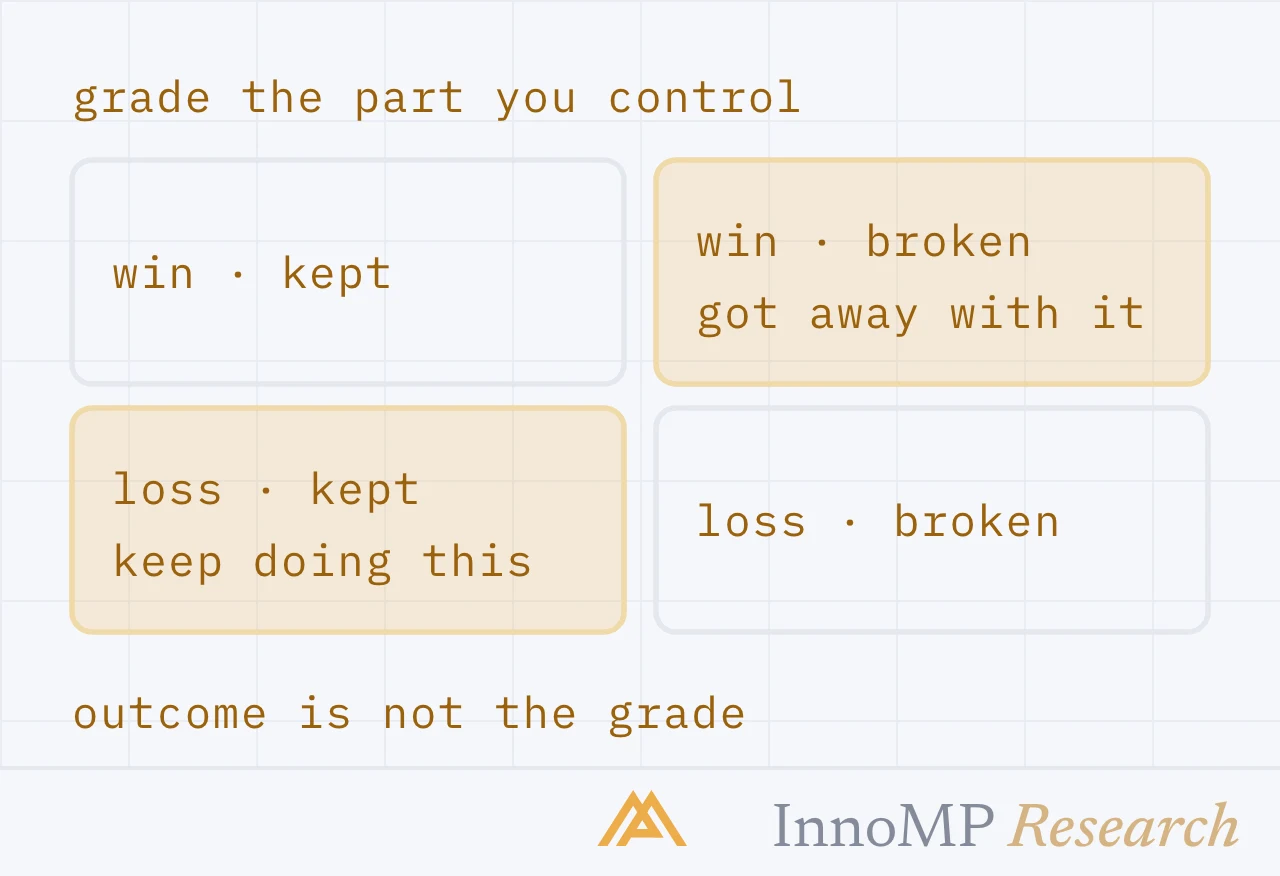
A trading journal is the only reliable way to detect this in yourself, because it records what you thought before you knew the outcome.

Record the setup, the invalidation level, and the case against the trade. Reviewed later, a pattern emerges: the trades where the “case against” section was thin or missing are usually the losers. That correlation is confirmation bias made visible, and it is far more persuasive than any general warning.

Next: Recency and availability bias — why the last few trades feel more informative than they are.

Key facts
  • Confirmation bias operates before conscious reasoning, so it does not feel like bias.
  • In charting it shows as timeframe shopping and indicator stacking.
  • It intensifies once a position is open, because the view now has money attached.
  • Writing the invalidation condition before entry converts a vague view into a testable one.
Frequently asked questions

What is confirmation bias in trading?

The tendency to notice and believe evidence that supports a trade idea while dismissing evidence against it. It typically shows up as looking at more timeframes or indicators until one of them agrees with the view you already held.

How do I know if I have confirmation bias?

Ask what would make you wrong, and whether you can state it as a price. If you cannot — or if the answer keeps moving as price moves — the view is not testable, which is the signature of a conclusion looking for support.

Why does confirmation bias get worse after I enter a trade?

Because the view now has money and self-image attached. Evidence against the position is also evidence that you made a mistake, which makes it more costly to accept and therefore easier to explain away.

How do I avoid confirmation bias when analysing charts?

Decide the timeframes and tools before looking, write the invalidation level before entering, and make a habit of stating the opposing case explicitly. Checking whether you would take the opposite trade at the same price is a fast test.

InnoMP Research

Market research, trading education and platform guides from the InnoMP research desk — covering forex, metals, indices and stock CFDs.

Published 31 Aug 2026 · Updated 31 Aug 2026 · Reviewed by InnoMP Compliance

Disclaimer: This content is provided for general informational purposes only and does not constitute investment advice, an offer, or a solicitation to buy or sell any financial instrument. It has been prepared without regard to your individual financial circumstances or objectives. Trading CFDs involves a high risk of loss.

Related notes