The trading journal: recording decisions, not just results
A list of profits and losses teaches almost nothing. What to record instead, and why the fields that matter are the ones written before the outcome is known.
IRInnoMP Research · Education Desk Published 31 Aug 2026 · Updated 31 Aug 2026 4 min read
In short
A trading journal records each trade's setup, reasoning, risk and emotional state alongside its result. Its value comes from the fields written before the outcome is known, because those are the only ones not contaminated by hindsight. Reviewed in aggregate, a journal replaces recall — which is biased toward recent and vivid trades — with an accurate distribution.
A trading journal records decisions, not just results. A spreadsheet of profits and losses tells you what happened. It does not tell you why, and it cannot distinguish a good decision that lost from a bad one that won.
The difference is a matter of when each field is written.
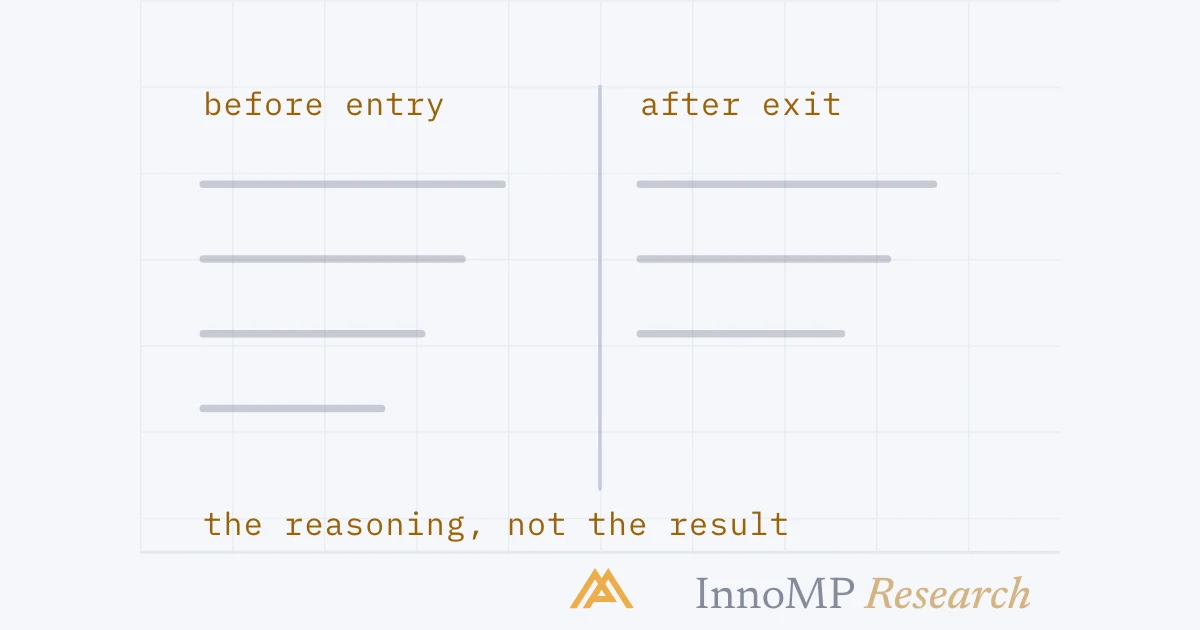
Before and after
The left column is the valuable half — the only record of what you actually thought before you knew. Hindsight cannot rewrite it.
Everything recorded before the outcome is known is honest. Everything recorded after is subject to hindsight — the tendency to remember having believed what turned out to be true.
Record in R-multiples
Log results as multiples of initial risk rather than in currency. A full stop-out is −1R; a win at twice the risk is +2R.
The plan said 1:2. The record says the winners were closed at a fifth of that. Currency amounts hide this; R-multiples cannot.
This makes a gold trade and a EUR/USD trade directly comparable, exposes management honestly — a column of +0.4R exits from 1:2 plans is cutting winners visible at a glance — and makes expectancy computable:
Expectancy = (win rate × average win in R) − (loss rate × average loss in R)
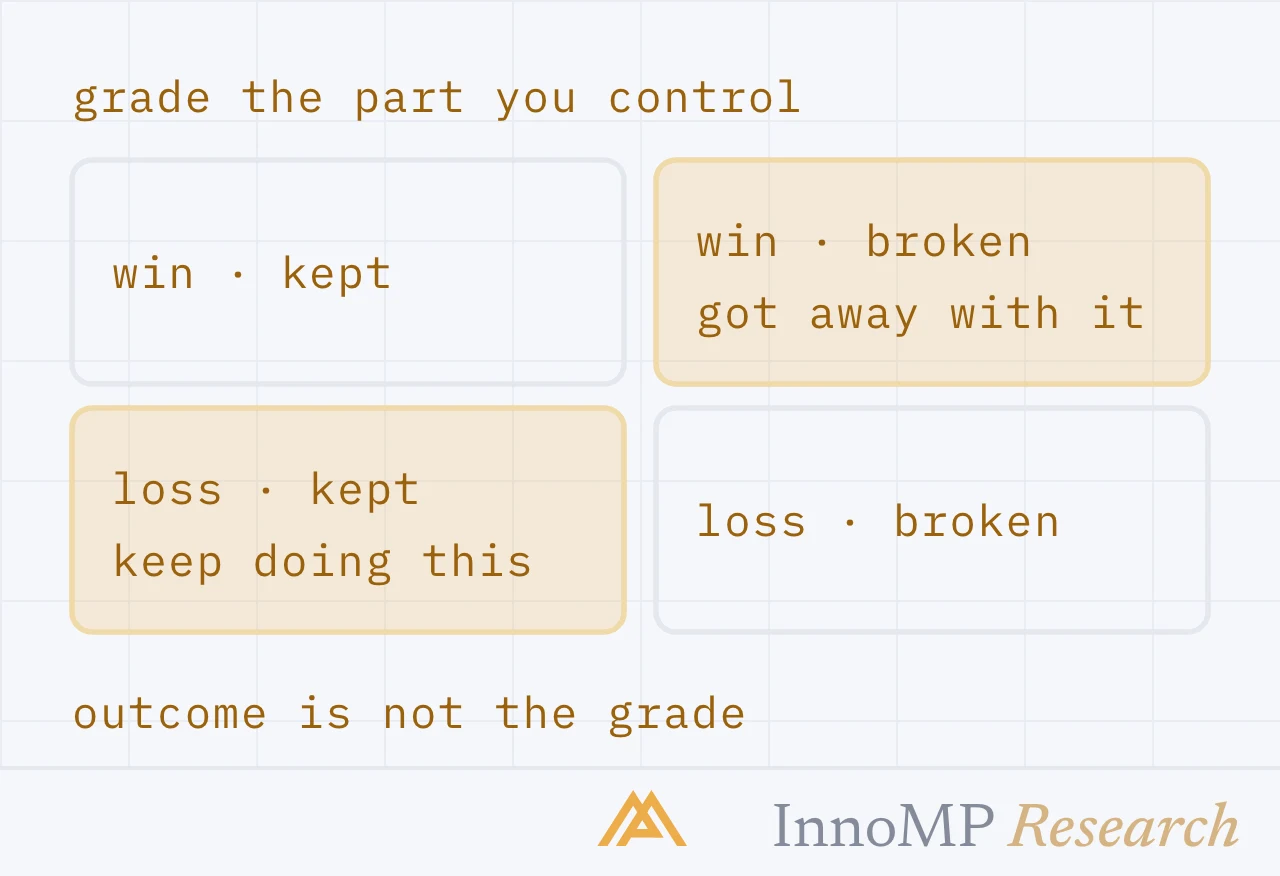
The rule-compliance field
Recorded independently of profit. The two highlighted cells are what defeats outcome bias.
That separation defeats outcome bias. A trader whose compliance rate is 60% does not have a strategy problem — they have a different strategy than the one they think they are running.
Key takeaway
The journal’s job is to replace memory. Memory is biased toward the recent and the vivid, which is exactly the distortion described in Part 4. A record of 60 trades outranks a feeling about the last five — but only if you review the record rather than the feeling.
Reviewing it
Reviewing only recent trades reproduces the bias the journal exists to solve. The aggregate is the point. An elaborate journal gets abandoned in week three. Eleven fields survives a year, which matters more than any refinement.
Keep it light enough to survive
An elaborate journal gets abandoned in week three. A spreadsheet with a dozen columns does not.
The minimum viable version: date, instrument, setup, entry, stop, target, planned R, state, result R, compliant yes/no, one line. Eleven fields, two minutes per trade. That is enough to produce every insight above, and light enough that you will still be doing it in a year — which matters more than any refinement.
Fields recorded before the outcome are the only ones free of hindsight bias.
Recording results in R-multiples makes trades of different sizes and instruments comparable.
A rule-compliance field separates good decisions from good outcomes.
Aggregate review counters recency and availability bias by replacing memory with a record.
Frequently asked questions
What should I record in a trading journal?
Before entry: the setup, the reason, entry, stop, target, planned risk in R, and how you feel. After exit: the result in R, whether the trade met your written criteria, and one line on what you would repeat or change.
Why record how I feel before a trade?
Because it is the only way to see the correlation between emotional state and outcome. Reviewed across fifty trades, the pattern linking 'frustrated' or 'impatient' entries to losses is usually obvious — and far more persuasive as your own data than as general advice.
What is an R-multiple?
A result expressed as a multiple of the initial risk. A full stop-out is −1R; a win at twice the risk is +2R. It normalises across instruments and position sizes so trades become directly comparable.
How often should I review my journal?
Briefly after each session, and properly on a fixed cadence — monthly, or every 30 to 50 trades. Aggregate review is what counters recency bias; reviewing only the last few trades reproduces the problem the journal exists to solve.
IR
InnoMP Research · Education Desk
Trading education from first principles — position sizing, risk, market structure and the habits that keep accounts alive. Written for someone who has never opened a chart, with a diagram at every step.
Published 31 Aug 2026 · Updated 31 Aug 2026
Disclaimer: This content is provided for general informational purposes only and does not constitute investment advice, an offer, or a solicitation to buy or sell any financial instrument. It has been prepared without regard to your individual financial circumstances or objectives. Trading CFDs involves a high risk of loss.
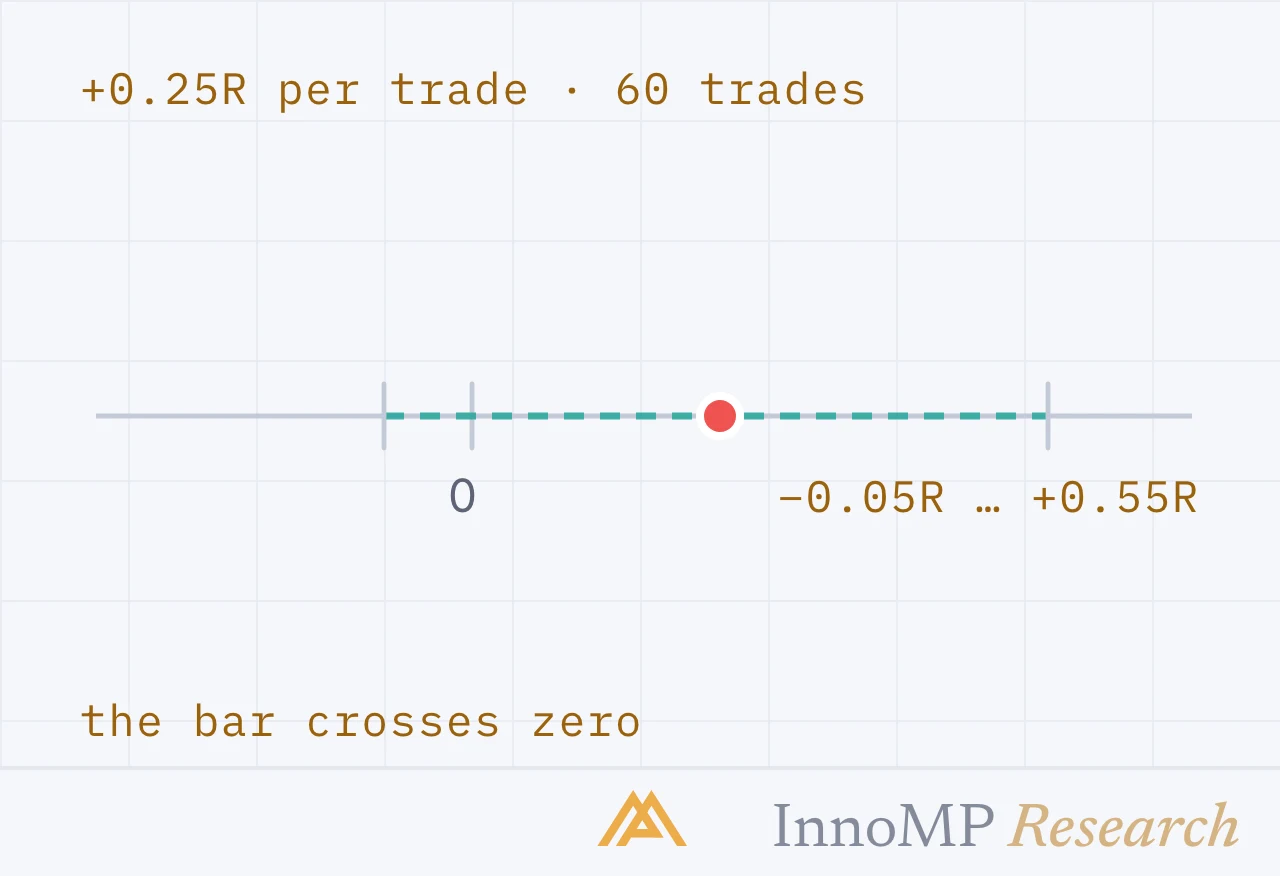
A record says +0.25R per trade. The question is how far from that the truth could be. How to put a standard error and a confidence interval on expectancy, and how many trades it takes to tell an edge from zero.
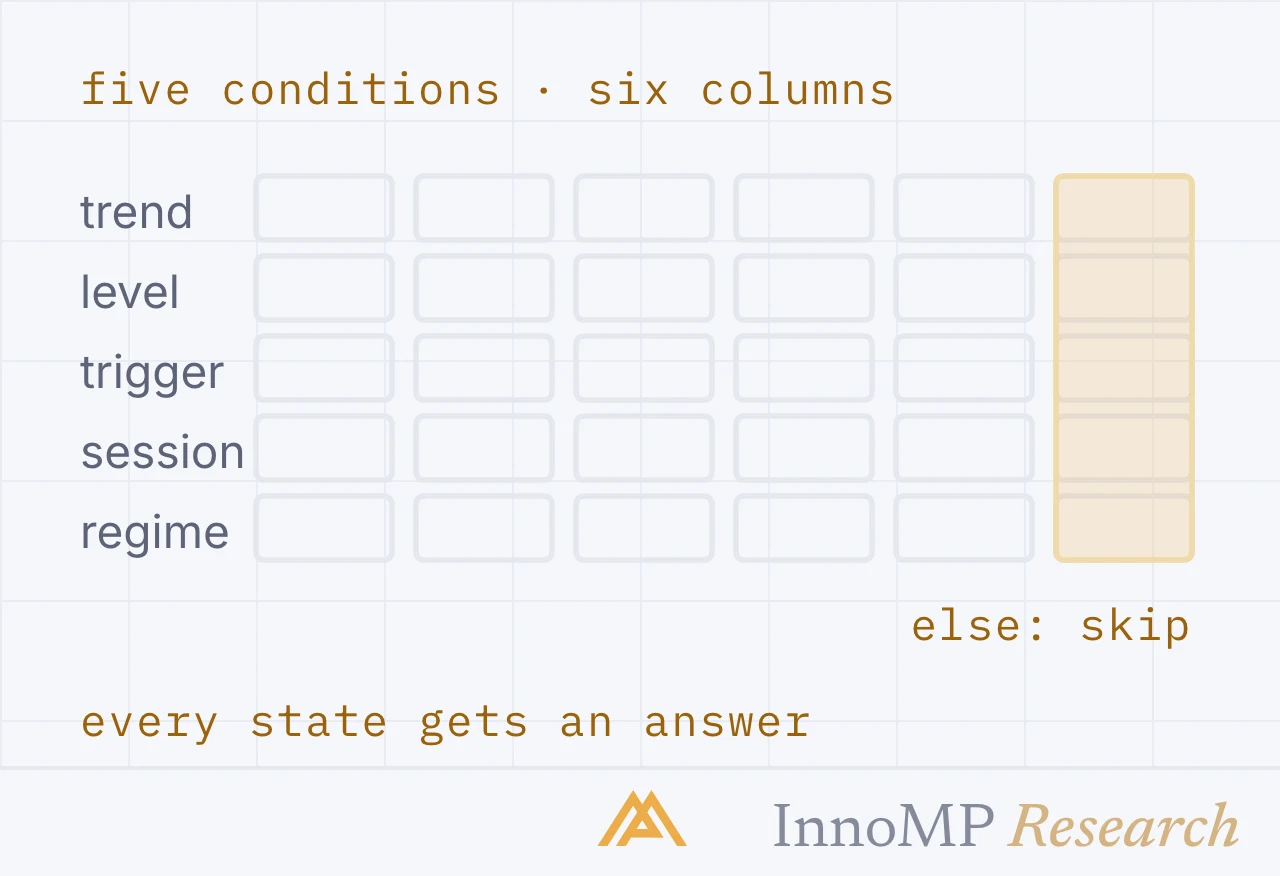
A written setup still leaves gaps: market states its prose never mentioned. How to lay the rules out as a decision table — conditions down the side, a column per rule — and find the gaps and contradictions first.