The stochastic oscillator measures where the current close sits within the recent high-low range, on a 0–100 scale. KDJ is a variant used widely in Asian markets that adds a third line, J, which amplifies the divergence between the other two. Both are momentum oscillators like RSI, and because most indicators are transformations of the same price series, adding more of them produces false confirmation rather than new information.
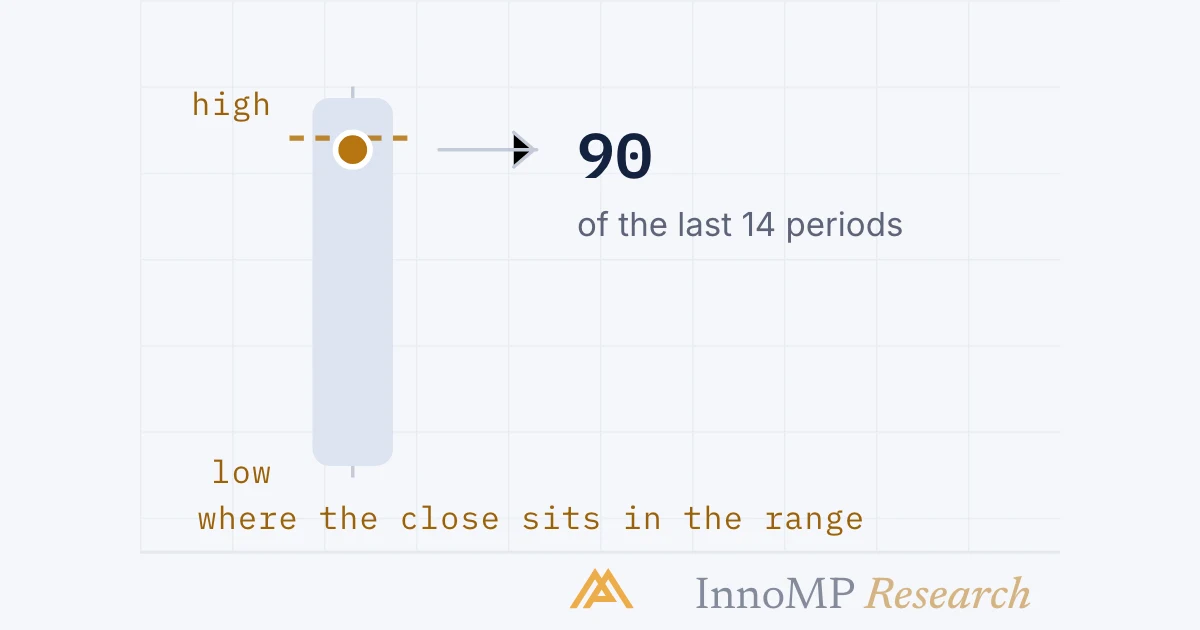
The stochastic oscillator measures where the current close sits within the recent high-low range. If the last 14 periods spanned 1.0800 to 1.0900 and price closed at 1.0890, stochastics reads near 90 — price closed near the top of its recent range.
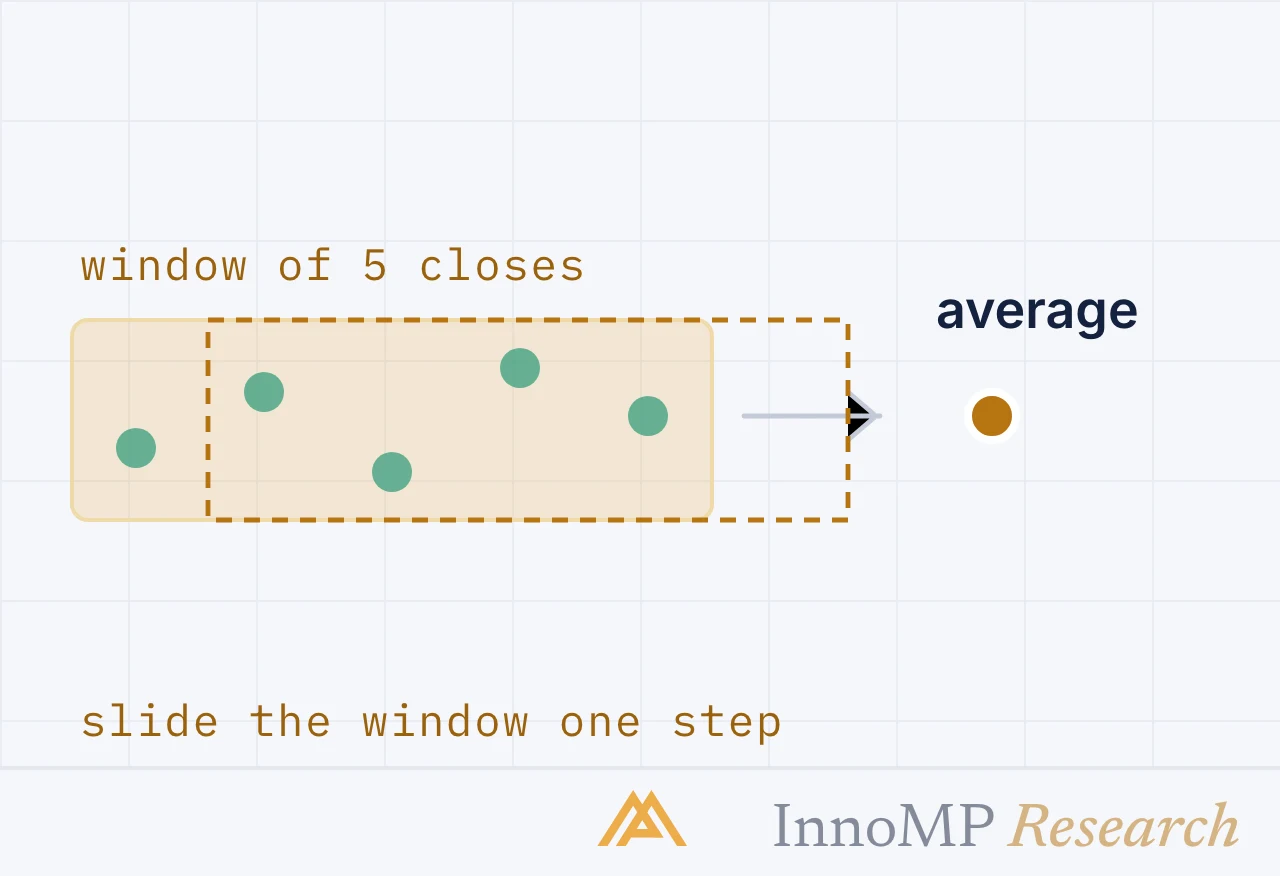
%K is that raw calculation. %D is a smoothed average of %K, used as a signal line. Readings above 80 are conventionally overbought, below 20 oversold.
Every caution from RSI transfers unchanged. In a trend, stochastics can pin near an extreme for many periods.
KDJ
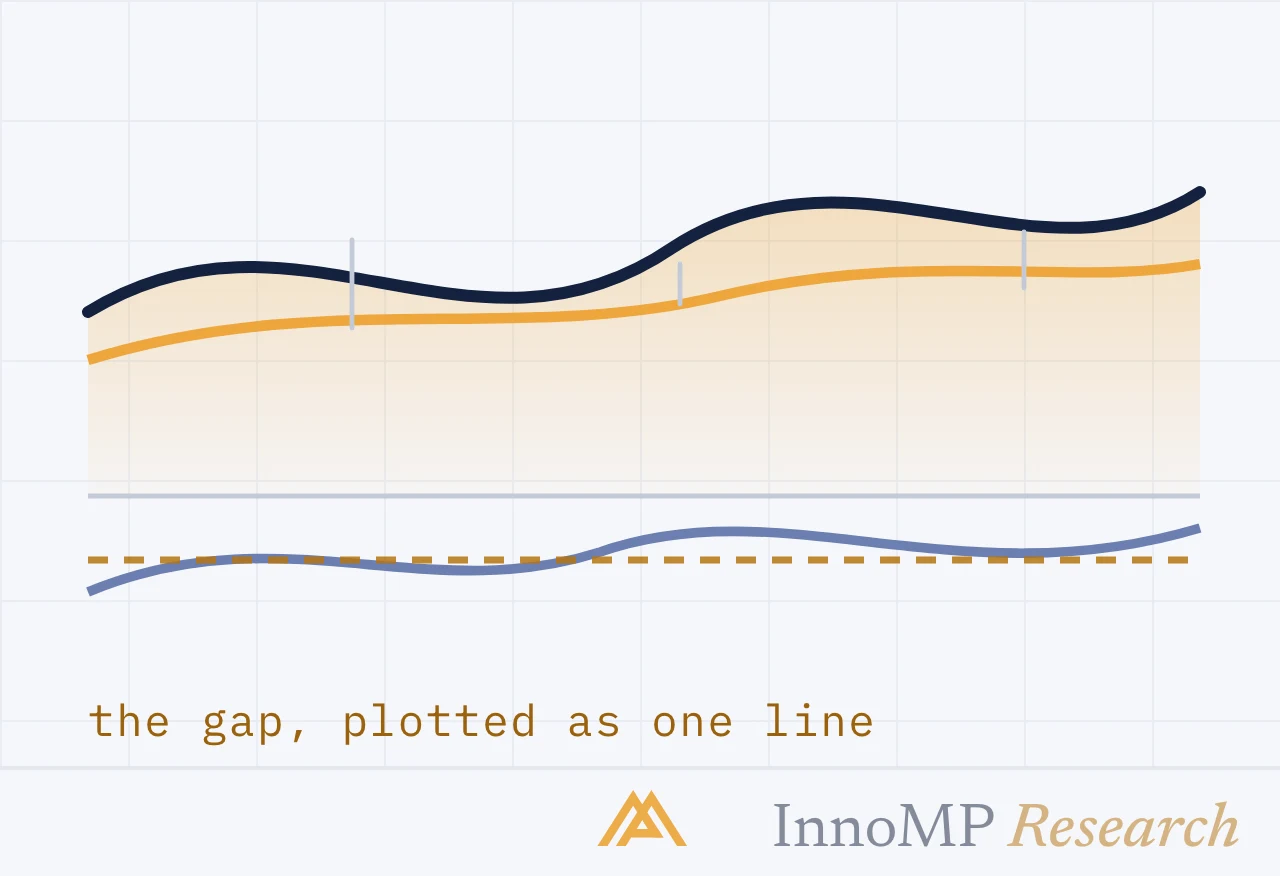
KDJ is a stochastic variant used widely in Asian markets and available in InnoMP’s Market Watcher. K and D correspond to the standard stochastic lines. J is derived from both — typically 3K − 2D — and moves further and faster than either.
The closing argument of this series
RSI, stochastics and MACD rise and fall at nearly the same moments.
They are not three independent opinions. They are three transformations of one price series, and their agreement is arithmetic rather than evidence. A trader who waits for all three to align has not found confirmation — they have found the same fact reported three times, and have delayed their entry to get it.
This is the most expensive habit in technical analysis, and it is worth naming plainly: adding indicators feels like reducing uncertainty and actually reduces only the number of trades you take, while introducing the illusion that a crowded chart is a rigorous one.
Key takeaway Genuine confluence comes from different kinds of evidence: a horizontal level (Part 5), a structural read (Part 7), a candle rejection (Part 11), and momentum (Parts 17–19). Four independent things agreeing means something. Four oscillators agreeing means one thing, counted four times.
What to keep
After twenty parts, the durable core is short:
Structure first. Trend or range (Part 4), read from swing highs and lows (Part 7). This answers what kind of market you are in, which determines every subsequent choice.
Levels second. Support and resistance (Part 5), trendlines (Part 6). This answers where.
Candles and patterns third. They confirm what happens when price arrives at a level — timing, not reason.
One or two indicators, last. A moving average for trend context. ATR for stop distance — the one indicator that feeds directly into how much you trade rather than what.
That is a complete method. Everything else in this series is refinement.
Where the actual edge is
An honest closing note. Everything above concerns analysis, and analysis is the part of trading that receives most attention and produces least differentiation. Two traders with the same chart read routinely get opposite results.
The difference is downstream:
- Position sizing — whether a losing run is survivable
- Stop placement — whether the invalidation point is real or convenient
- Cost awareness — whether the strategy nets out after spread and swap
- Consistency — whether the method survives a drawdown intact
Technical analysis tells you what the chart shows and where you would be wrong. That second half is what makes it useful — a defined invalidation point is what allows a position to be sized, and sizing is what determines whether you are still trading in a year.
Use the position size calculator on your next setup. It takes the level you found on the chart and turns it into a number of lots. That step — chart to arithmetic — is where analysis becomes trading.
Continue with Level 2: Technical Analysis: Intermediate — it starts with reading three timeframes in a fixed order.
- Stochastics measure the close's position within the recent high-low range.
- %K is the raw calculation and %D is a smoothed average of it.
- KDJ adds a J line calculated from K and D, which moves further and faster than either.
- Most indicators derive from the same price data, so agreement between them is not independent evidence.