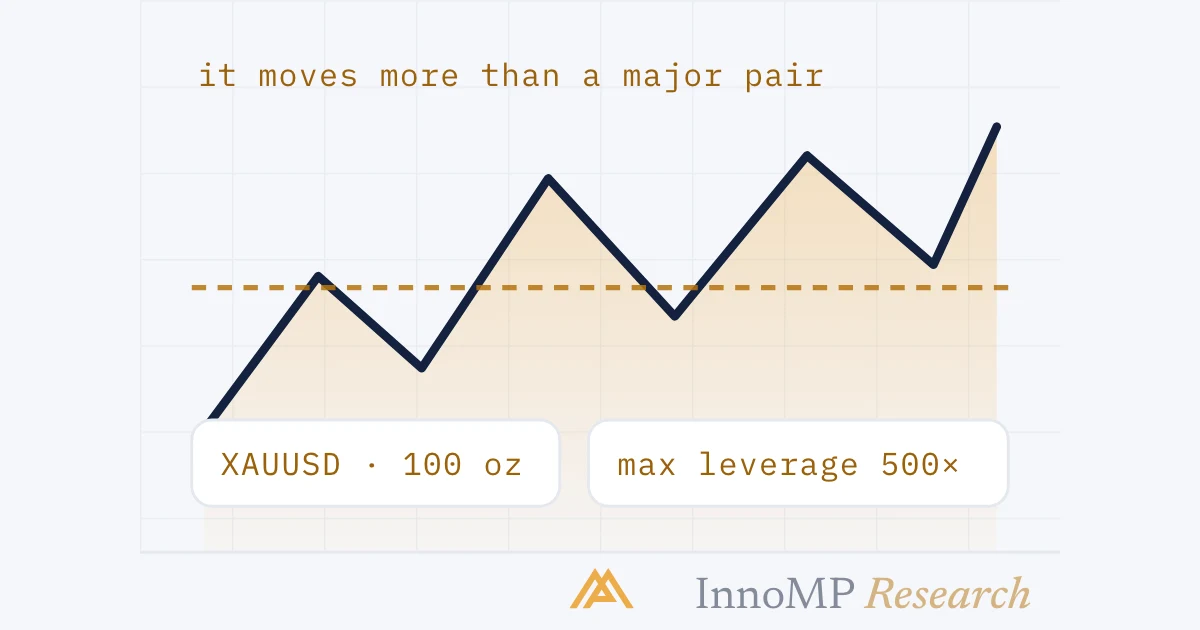
Gold (XAUUSD) is priced in US dollars per troy ounce and moves mainly with real yields and the dollar, because it pays no interest. On InnoMP one lot is 100 troy ounces, so a one-dollar move is 100 USD per lot, leverage is capped at 1:500 and the contract trades 24/5 with a daily break. Liquidity is deepest in the London–New York overlap. Because gold's daily range is a multiple of a major currency pair's, size from the stop distance and the 100 USD point value — never from forex habits.
Gold is often the second market a new trader falls for, right after their first currency pair — it trends beautifully in hindsight and moves enough to be interesting daily. It is also faster and less forgiving than the majors. This is a framework for trading it deliberately: drivers, contract, sessions, and size.
What actually moves gold
Gold pays no interest. That single fact organises nearly everything about how it trades.
Real yields. Holding gold means forgoing the yield on cash or bonds. When real (inflation-adjusted) yields fall, the cost of holding gold falls, and gold tends to rise. This is the cleanest persistent relationship in the metal — when a gold move is confirmed by a real-yield move, it carries more weight than one that is not, a point worth checking before trusting a gold move.
The dollar. XAUUSD is a dollar price, so dollar strength is a headwind mechanically and vice versa. Gold moving against the dollar’s direction is a signal of genuine demand worth noticing.
Official and haven demand. Central bank buying operates on a horizon far longer than any trade, and stress bids appear when confidence in other assets wobbles. Both are real; neither is timeable.
The practical use of drivers is filtering, not forecasting: a technical setup aligned with the real-yield picture deserves more confidence than one fighting it.
The contract
XAUUSD quotes dollars per troy ounce. The InnoMP contract specifics that matter before the first order:
- Contract size — one lot is 100 troy ounces, so a one-dollar move is 100 USD per lot. Sizes run from 0.01 to 20 lots.
- Leverage — up to 1:500 on gold, a tier below the 1:1000 available on major forex pairs; the margin calculator in the order ticket reflects it.
- Trading hours — gold trades 24/5 with a daily settlement break, not a 24/7 clock. Positions cannot be exited during the break, so it is part of your risk.
- Swap rates — gold carries meaningful financing, and multi-week holds routinely pay more in swap than in spread. The arithmetic is in the real cost of a trade.
Sessions and the calendar
Gold’s liquidity is deepest in the London–New York overlap, and its calendar risk is concentrated in US data — CPI, payrolls, and Fed communication — because the drivers are dollar rates. The economic calendar playbook applies to gold with extra force: spreads widen further and the first move reverses more often than in the majors.
The Asian session tends to be quieter and ranged; a breakout there earns more scepticism than the same pattern in London hours.
Key takeaway Gold’s average daily range is a multiple of a major currency pair’s. A position sized by feel — with sizes carried over from EURUSD habits — is oversized in gold by default. Size from the stop distance and the contract’s point value, never from habit.
Sizing for gold specifically
The position-sizing arithmetic applies unchanged; only the inputs are bigger. A worked example on a 10,000 account risking 1%:
- Risk budget: 100
- Stop distance from the chart: say 12.00 in price terms
- Point value at 100 oz/lot: 100 per dollar of movement
- Size: 100 ÷ (12 × 100) = 0.08 lots
Run it yourself in the position size calculator — gold is pre-loaded at 100 oz per lot. Notice what the volatility did: an honest gold stop produced a position under a tenth of a lot. Traders uncomfortable with that number are discovering their EURUSD sizing was never adjusted for the instrument — the discomfort is the lesson.
Stops in gold need wider buffers than instinct suggests: the metal probes levels aggressively, and a stop parked exactly at an obvious swing point is inside the noise, a failure mode covered in stop placement.
A closing framework
Trade gold with three questions on every idea: What are real yields doing? Where is the level structure — drawn in a quiet moment, not mid-move? What size does the stop distance permit? Two of the three answered honestly beats a strong opinion on direction every time — in gold more than most markets, because the moves are large enough to reward discipline and punish its absence in the same week.
- XAUUSD quotes US dollars per troy ounce; one InnoMP lot is 100 troy ounces, so a 1.00 move is 100 USD per lot.
- Gold pays no interest, so it tends to rise when real yields fall and to weaken when the dollar strengthens.
- InnoMP leverage on gold is capped at 1:500, one tier below the 1:1000 available on major forex pairs.
- Gold trades 24/5 with a daily settlement break; positions cannot be exited during the break.
- On a 10,000 USD account risking 1% with a 12.00 stop, the position is 0.08 lots.