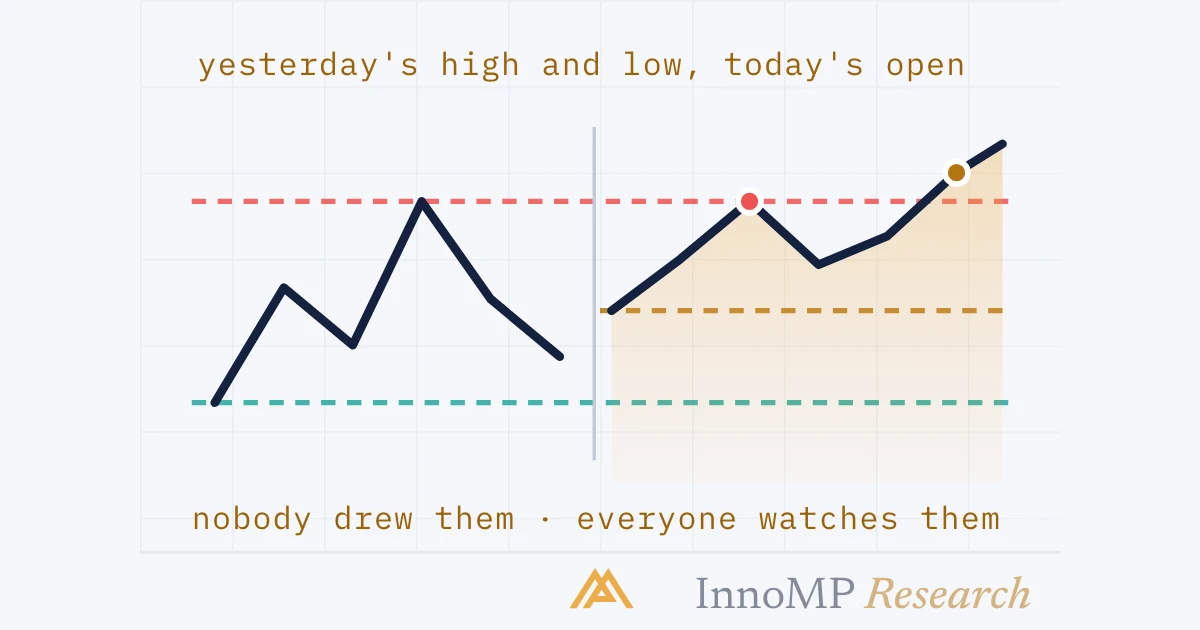
Session reference levels are the prices a trading day and week leave behind — the previous day's high and low, today's open, the weekly open, last week's high and low, and each session's extremes. They act as support and resistance because so many participants watch them that orders cluster there. They are drawn mechanically from candle data, need no judgement, and sit on the trading chart beside the higher-timeframe levels — which they often coincide with, and which outrank them when they do not.
A reference level is a price the calendar leaves behind — the previous day’s high and low, today’s open, the weekly open — that acts as support or resistance because it is watched by so many participants that orders cluster there.
Part 8 read the trading day as a sequence of opens. Each of those opens, and each day and week, leaves marks on the chart that nobody had to draw. This part is about those marks: which ones matter, why they work at all, and where they rank against the levels that structure produced in Part 2.
A level nobody drew
Support and resistance in Foundations was explained as where participation clustered before. Reference levels satisfy the same definition from the other direction. Nobody needed to find a swing point; the level is on every chart automatically, at the same price, in the same place — and because everyone can see it, everyone acts around it.
That is also the limit of the reason. A reference level carries no information about why price should turn there. It is populated because it is visible, and it stops working the moment it stops being watched — which is why the ranking at the end of this part matters.
The set
Six levels cover nearly everything that is actually watched. All of them are read straight from the candle data.
| Level | Drawn from | What it tends to do |
|---|---|---|
| Previous day’s high and low | Yesterday’s daily candle | The most watched pair. Targets for one side, stops for the other |
| Daily open | Today’s first price | Bias line for the day: above it buyers are ahead, below it sellers |
| Weekly open | Monday’s first price | The same reading over the week |
| Previous week’s high and low | Last week’s candle | Wider targets and stops; watched on the 4-hour and daily |
| Asian range high and low | Part 8 | The first range London has to leave |
| London session high and low | The London hours | What New York inherits: extend it, or reverse it |
The absence of judgement is the point. A swing point from Foundations needs a rule about how many candles on each side; a trendline needs a decision about which touches count. Yesterday’s high is yesterday’s high. Two traders on the same platform will draw it identically, which is exactly why so many of them do.
The daily open
The simplest of the set, and the one most often skipped because it seems too simple.
Price above the open means that, on balance, buyers have had the session. Below it, sellers. That is a bias for the day in the sense Part 1 gave the word: a filter on which direction to look for setups in, not a reason to enter.
It ranks below the higher-timeframe bias. A day spent below the open inside a daily uptrend is a pullback — Part 4 — and the reading is “wait for the pullback to end,” not “sell.” The open is useful precisely on the days the two agree: a daily uptrend, a day holding above its open, and a pullback on the 1-hour chart into a level is a setup with three sources behind it.
The week
The same two readings at the next scale up. Monday’s first price is the weekly open, and last week’s candle leaves a high and a low that the 4-hour and daily charts watch all week.
Two practical notes. Monday’s relationship to the weekly open is set in the thinnest hours of the week — the Sunday-evening open Foundations described in weekend gaps — so it is read loosely until London has voted on it. And last week’s high and low are the reference levels most likely to coincide with a structural level from Part 2, because a weekly extreme is usually a daily swing point too. When they coincide, the level has two reasons.
Ranking them against structure
Reference levels come from the calendar. The levels in Part 2 come from structure — swing points, flips, range boundaries — and carry the participation of a daily chart. The two sets live on the same trading chart, and the question is what to do when they meet, and when they do not.
When they coincide, stack them. Yesterday’s high sitting inside a daily zone is confluence from two independent sources — one from structure, one from the calendar — and counts as two reasons.
When they conflict, structure wins. A previous-day low in the middle of a daily range, with no swing point or flip behind it, is one reason and the weaker one. It may produce a pause; it is not where Step 2 of the procedure waits for a setup.
When there is nothing else, they are still something. On a day with no structural level nearby, the previous day’s high and low are the most populated prices on the chart, and a reaction at one of them — read with the same wick, higher low and break from Part 2 — is real evidence. It is just evidence with a shorter life than a structural level’s.
Key takeaway Reference levels are populated because they are visible, and that is both their strength and their ceiling. Inside a structural zone they are confluence. On their own they are the best available level on a chart that has no better one — and outranked the moment a better one appears.
Pivot points, briefly
Pivot points are reference levels one step removed: derived arithmetically from the previous day rather than read off it. The classic form takes the previous day’s high, low and close, averages them into a pivot, and projects the first support and resistance from it.
| Level | Formula |
|---|---|
| Pivot (P) | (High + Low + Close) ÷ 3 |
| First resistance (R1) | 2P − Low |
| First support (S1) | 2P − High |
They are calculated once from the completed daily candle and do not move through the day. They are watched for the same reason the previous day’s high and low are — they are on many screens at the same price — and they carry no more information than the three prices they are made from. Treat them exactly as the table above treats reference levels: stacked with structure, a reason; alone, a weaker one.
Which “yesterday”?
Everything in this part is drawn from a daily candle, and that candle has a beginning and an end that the platform chose. Two traders on two platforms can draw different previous-day highs for the same date, because their brokers’ servers put midnight in different places — which also decides where the daily open sits, which day the weekly open falls in, and what the pivot formula is fed.
That is not a small footnote to reference levels; it is the ground they stand on, and it is the last part of this group.
Next: Daily candles and server time — why your daily chart differs from someone else’s, and what moves with it.
- The previous day's high and low, the daily open and the weekly open are the most widely watched reference levels.
- Reference levels work because they are watched: orders cluster at prices many participants can see.
- They are drawn mechanically from candle data, with no judgement about swing points.
- A reference level inside a higher-timeframe zone is confluence; one that conflicts with the zone is outranked by it.
- The classic pivot point is the previous day's high, low and close averaged; its supports and resistances are derived from it.