A higher-timeframe level is a support or resistance level identified on a chart above the one you trade — usually the daily — and drawn onto the trading chart so that setups are looked for where the largest participation clustered. On the smaller chart it is a zone, not a line, because the daily wicks that made it span several hourly candles. Three kinds of level are worth carrying down: the last swing low or high that defines structure, a level that has recently flipped, and the boundaries of a daily range.
A higher-timeframe level is a support or resistance level found on a chart above the one you trade, and drawn onto the trading chart so that entries are looked for where the largest participation clustered. On the smaller chart it becomes a zone, not a line.
Part 1 ended Step 1 with two things written down: the bias, and the level that would cancel it. This part is about the levels — which ones deserve the trip down, what happens to them on the way, and what a real reaction at one looks like once they arrive.
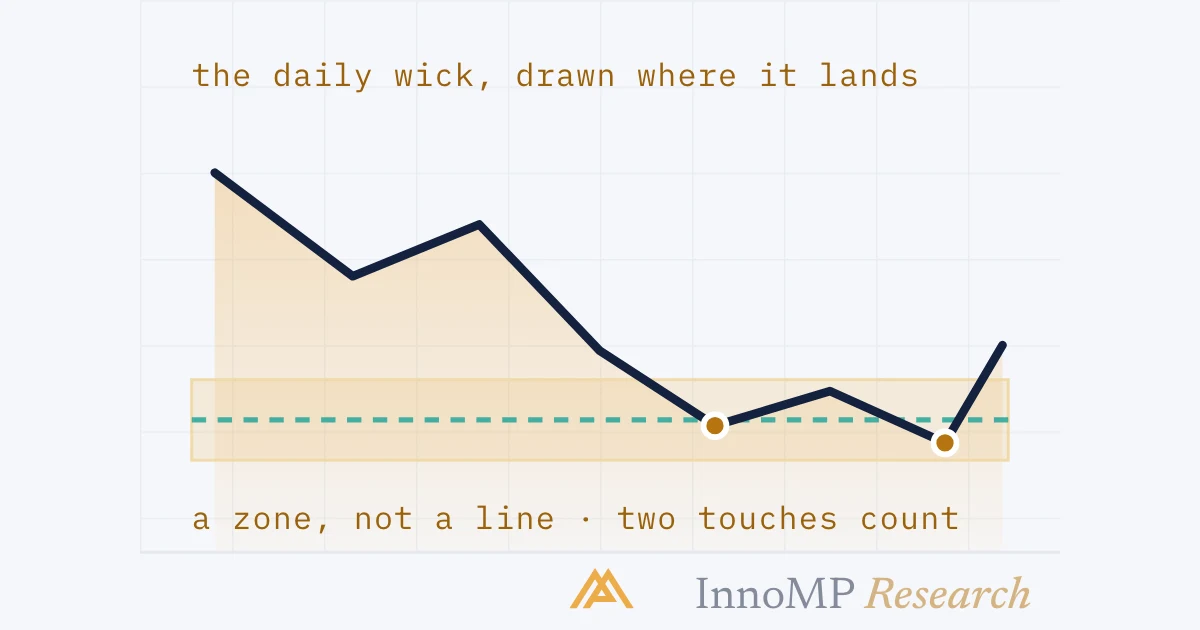
A daily level is a zone on the hourly chart
Support and resistance in Foundations was drawn as zones from the start, and the reason becomes literal here. One daily candle contains twenty-four hourly candles. The wick that made a daily low — one thin line on the daily chart — is, on the hourly chart, a vertical range that several candles traded through.
This is why a trader who draws a daily level as a single line on the 1-hour chart keeps finding that price “missed” it by a few pips, or “broke” it and came back. Neither happened. Price went into the zone and came out, which is what respecting a level looks like at that resolution.
Which levels to carry down
Not every line on the daily chart earns a place on the trading chart. Three kinds do, and each has a reason.
A — the structure level. The last higher low in a daily uptrend, or the last lower high in a downtrend. It is the level from Part 1: the bias holds while price stays on the right side of it, and a daily close through it sends the whole read back to Step 1. This one is never optional.
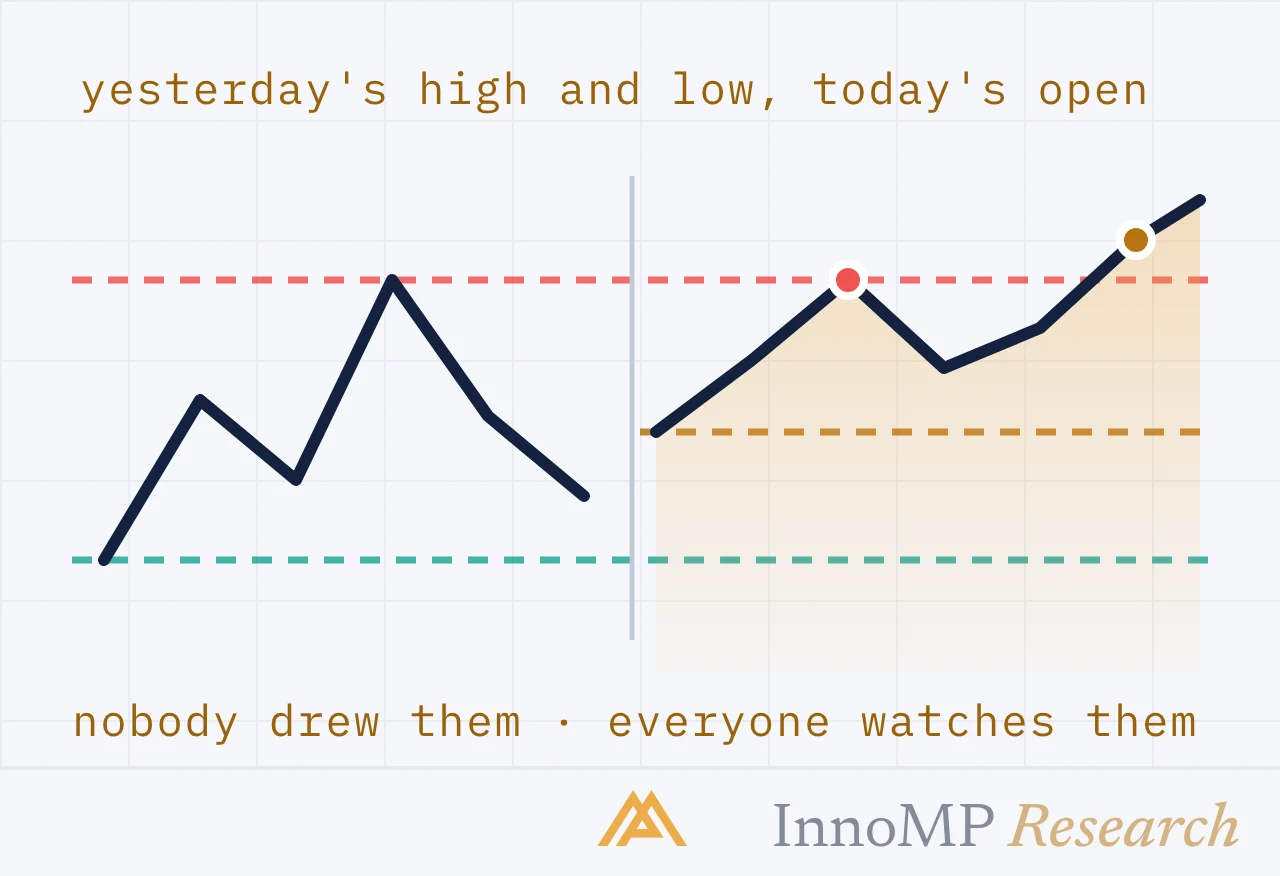
B — the most recent flip. A daily high that price broke, returned to, and held above — the level flip from Foundations. A flip proves the participants who sold there have repriced; the level is now theirs to defend. Flipped levels are where trend pullbacks tend to end, and a pullback ending is precisely what Step 2 is waiting for.
C — the boundary. The current high in an uptrend, or the range edges if the daily is not trending. This is where the target usually lives, and where a long bias will be tested. It is also the level a breakout would have to clear.
Three, sometimes four. A trading chart with ten daily levels on it is a chart where none of them is being respected, because whichever way price moves it is “at a level.”
Drawing the zone
The width of the zone is not a matter of taste. It is the vertical range of the daily wicks that formed the level — the distance between the lowest low and the highest of the lows that touched it.
Two practical consequences.
A touch anywhere in the zone is a touch. Whether price reached the top of it or the bottom is not information about the level’s strength; it is information about which hourly candle happened to arrive.
The stop goes beyond the zone, not beyond the line. A stop placed just under the mid-point of a zone is inside the level, where stop hunting does its work. The buffer from stop placement is measured from the zone’s far edge.
Reaction, not touch
Price arriving at a daily level is not a signal. It is the place to look for one. The signal — the reaction — is read on the trading chart, and it has a shape.
1 — Rejection. A candle reaches into the zone and closes back out of it, leaving a wick. Foundations’ candlestick anatomy applies: the wick is the part that was rejected. On its own, this is one candle’s opinion.
2 — A higher low. The next dip stops above the rejection candle’s low. Now the zone has held twice, at the resolution of the trading chart, and the small structure inside the pullback has changed.
3 — The break. Price closes above the last minor high between those two lows. That is a break of structure on the trading chart, in the direction of the daily bias — and it is the trigger Part 1’s Step 3 was waiting for.
Any one of these alone is a touch. Traders who enter on step 1 are guessing that steps 2 and 3 will follow; often they do not, and the “level failed.” It did not fail. It was never confirmed.
Key takeaway The daily chart says where to look. The trading chart says whether anything happened there. Reading the reaction on the daily chart instead means waiting a day for each candle — by which time the trading chart has already answered.
Keeping the map honest
Levels have a life. The map of daily levels is redrawn at the daily close, not during the day — an hourly wick through a daily level is not a daily break, and treating it as one throws away a level that is probably still there.
At each daily close, three questions:
- Did price close through a level? If so, it is no longer that kind of level. It may flip; until it does, it comes off the chart.
- Has a new swing formed? A new higher low replaces the old one as the structure level. The old one stays only if it has a second reason to.
- Is anything still there from a week ago that price has not been near? Distant levels are not wrong, but they are not where Step 2 is looking. Fade them, or keep them on the daily only.
A trading chart should carry the levels that are true today. The point of carrying them down at all is to know where the trading chart’s setups are worth taking seriously — and that only works if the lines mean something.
Next: Multi-timeframe confluence — when the three charts agree, what that agreement is worth, and why two indicators on the same chart are not two reasons.
- A daily level drawn on an hourly chart is a zone the width of the daily wicks that formed it.
- Three daily levels are worth carrying down: the structural swing point, the most recently flipped level, and range boundaries.
- A touch anywhere inside the zone counts as a touch of the level.
- A reaction is read on the trading chart, not the daily: a rejection wick, a higher low, and a break of the last minor high.
- A level that has been broken and not flipped is removed from the chart at the daily close.