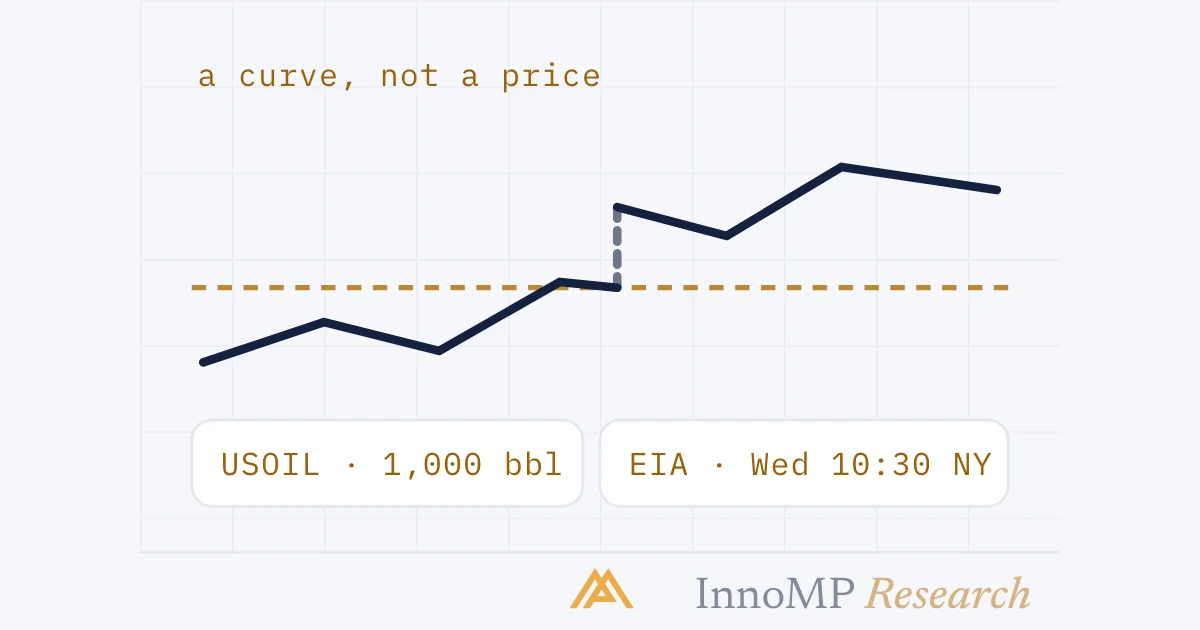
USOIL is a CFD on West Texas Intermediate crude, quoted in US dollars per barrel. The price it tracks is a monthly futures contract, so the CFD is rolled to the next contract on a schedule and its price steps by the gap between the two. Oil moves on supply — OPEC+ decisions and US inventories — on demand expectations, the dollar and geopolitics. The standard contract is 1,000 barrels, so a one-dollar move is 1,000 USD per lot; the EIA inventory report at 10:30 New York on Wednesdays is the fixed weekly event.
Oil is the market in this series that behaves least like a chart. Gold, silver, an index and a currency pair each have a price you can point to. Oil has a curve — a row of monthly futures contracts, each with its own price — and a CFD on crude tracks one of them at a time. That single fact explains most of what surprises traders about oil: why the price sometimes steps overnight for no reason on the news, why holding it for weeks costs more or less than the swap suggests, and why a Wednesday morning has more calendar risk than a Fed day. This is a framework for trading it deliberately.
What actually moves oil
Supply decisions. Oil is the one major market where a small group of producers sets policy on output. OPEC+ decisions on production quotas move the price directly and are scheduled in advance; unscheduled statements move it just as far. There is no equivalent in gold or currencies.
Inventories. The US Energy Information Administration publishes stock levels every week. A build in crude inventories reads as supply exceeding demand; a draw reads as the reverse. The market reacts to the gap against expectations, and the reaction is often sharp because the number is a hard physical quantity rather than a survey.
Demand expectations. Oil demand tracks the global economy, so growth data and the manufacturing cycle move it. This is the same industrial driver silver carries, but oil carries it almost entirely.
The dollar and geopolitics. Crude is priced in dollars, so dollar strength is a mechanical headwind. And supply runs through a small number of regions and shipping routes, so events in them move price faster than any data can — the reason oil gaps more often than the other markets here.
The practical use is unchanged: drivers filter, they do not forecast. A technical setup aligned with the supply picture deserves more confidence than one fighting a quota decision.
The contract, and the roll
USOIL quotes dollars per barrel of WTI. The specifics that matter before the first order:
- Contract size — the standard crude contract is 1,000 barrels per lot, so a one-dollar move is 1,000 USD per lot and the smallest increment of 0.01 is 10 USD. The calculators on this site use the standard size; confirm it in your platform’s contract details.
- Leverage — energy carries a lower maximum than major forex pairs. The margin calculator in the order ticket applies the tier for oil.
- Trading hours — near round-the-clock on weekdays with a daily break, like the metals.
Then the part that is specific to oil.
The underlying is a futures contract, and futures expire. WTI futures come in monthly contracts. A CFD on crude tracks the nearest one, and shortly before that contract expires it is switched — rolled — to the next month. At the moment of the roll, the CFD’s quoted price steps to the next contract’s price. If the next month is dearer, the quote jumps up; if cheaper, it drops. Nothing happened to oil; the CFD changed which contract it was looking at.
Contango and backwardation. When later months cost more than nearer ones, the curve is in contango; when they cost less, it is in backwardation. This shape is the hidden cost of holding oil. In contango, each roll moves a long position onto a more expensive contract; in backwardation, onto a cheaper one. Brokers typically apply a cash adjustment at the roll so that the step itself does not pay or charge an open position — but the curve’s shape still shows up over weeks as a cost or a credit, on top of the ordinary swap. How your broker handles the roll and its adjustment is in the contract details, and it is worth reading before the first multi-week hold.
What this means for a chart. A daily chart of a rolled CFD contains those steps. A level that looks broken on the day of a roll may not have been; a gap that looks like news may be the roll. Knowing the roll dates is part of reading the chart.
Sessions and the calendar
Oil’s liquidity peaks in the US session — the WTI market is a US market — and especially in the hours after the cash open. London contributes; Asia is thin and tends to range.
Wednesday, 10:30 New York. The EIA’s Weekly Petroleum Status Report is the one fixed calendar event every week, released after 10:30 Eastern Time on Wednesdays and a day later in some holiday weeks. Treat it exactly as the calendar playbook treats a data release: spreads widen into it, the first move reverses more often than not, and a stop resting near price can be executed by the widened spread alone.
OPEC+ meetings are scheduled but their outcomes leak, are pre-announced, or are revised in statements between meetings. Around a meeting, the whole day carries event risk rather than a single minute.
The roll date is the third fixed point. It is not a market event, but it is a chart event, and a position held across it should have been sized with the curve’s shape in mind.
Key takeaway Oil’s risk sits in three places the chart does not label: the Wednesday inventory number, the supply decision that can land any day, and the roll that steps the price on a schedule. A stop sized for the visible range covers the first only on quiet weeks and the other two never. Size from a stop that respects all three, and expect the number to be small.
Sizing for oil
The position-sizing arithmetic is unchanged. A worked example on a 10,000 account risking 1%:
- Risk budget: 100
- Stop distance from the chart: say 1.50 in price terms
- Point value at 1,000 bbl/lot: 1,000 per dollar of movement, so 1.50 is 1,500 per lot
- Size: 100 ÷ 1,500 = 0.07 lots
Run it in the position size calculator — crude is pre-loaded at 1,000 barrels per lot. As in the metals, an honest stop produces a fraction of a lot, and the discomfort with that number is the lesson.
Two additions specific to oil. First, widen the stop or stand aside on Wednesday mornings; a stop that survives an ordinary day is inside the noise of an inventory release. Second, for anything held across a roll, check the curve: in steep contango a long position pays the roll every month on top of swap, and the position’s real cost is not what the daily chart shows.
A closing framework
Trade oil with four questions on every idea. What is the supply picture — quotas and inventories — doing, and does the setup agree? Which session am I in, and is it a Wednesday? Where is the next roll, and what shape is the curve? What size does a stop that respects all of that permit on a 1,000-barrel contract? Oil rewards the trader who treats it as a market with a calendar and a curve rather than as a line on a chart — and it is unusually quick to charge the one who does not.
- USOIL tracks West Texas Intermediate crude, priced in US dollars per barrel.
- The standard crude contract is 1,000 barrels per lot; a one-dollar move is 1,000 USD per lot and the 0.01 tick is 10 USD.
- The underlying is a monthly futures contract, so an oil CFD is rolled to the next contract on a schedule and its quoted price steps by the difference.
- Contango means later contracts cost more than nearer ones; backwardation means they cost less. The roll works against a long position in contango and for it in backwardation.
- The EIA Weekly Petroleum Status Report is released after 10:30 Eastern Time on Wednesdays, a day later in some holiday weeks.