US100 is a CFD on the Nasdaq-100 — 100 of the largest non-financial companies listed on Nasdaq, weighted by modified market capitalisation. It moves with the S&P 500 but further, because it is concentrated in a few large technology companies and more sensitive to interest rates. One lot is one contract and one index point is 1 USD, as on US500; but the level is several times higher, so the same lot carries several times the dollar risk per percentage move. Size in points from the stop, at this index's level.
US100 looks like US500 with a different number on the ticket: one contract per lot, one dollar a point, the same clock, the same Fed. The resemblance is exactly the problem. The Nasdaq-100 is a narrower, more concentrated and more rate-sensitive index that trades at several times the S&P 500’s level, and a trader who sizes it the way they size US500 has taken on several times the risk without meaning to. This is a framework for trading it deliberately, built on where it differs from the broad index.
What the index is, and why it moves more
A hundred non-financial companies, listed on Nasdaq. By its own methodology, the Nasdaq-100 measures 100 of the largest non-financial companies listed on the Nasdaq exchange, weighted by modified market capitalisation. Two words in that sentence do the work. Non-financial: banks and other financial companies are excluded by rule, which removes the sector that behaves most differently from technology and leaves an index tilted toward it. Nasdaq-listed: the constituents are drawn from one exchange, not the whole market.
Concentration, by design and by rule. Market-cap weighting means the largest companies dominate, and the methodology tells you how far that is allowed to go: no single company may exceed 24% of the index, and companies above 4.5% may not together exceed 48%. Those are caps, and the fact that they exist says how concentrated the index can become — a small number of names can carry close to half of it. When a handful of the largest constituents move, the index moves.
Rate sensitivity. Growth companies are valued on earnings expected years out, and the further out a cash flow is, the more a change in the discount rate changes its present value. That makes the Nasdaq-100 more sensitive to interest-rate expectations than the broader S&P 500, in both directions. The Fed’s eight scheduled decisions a year, and the inflation and payrolls data that shape them, move this index further than they move US500.
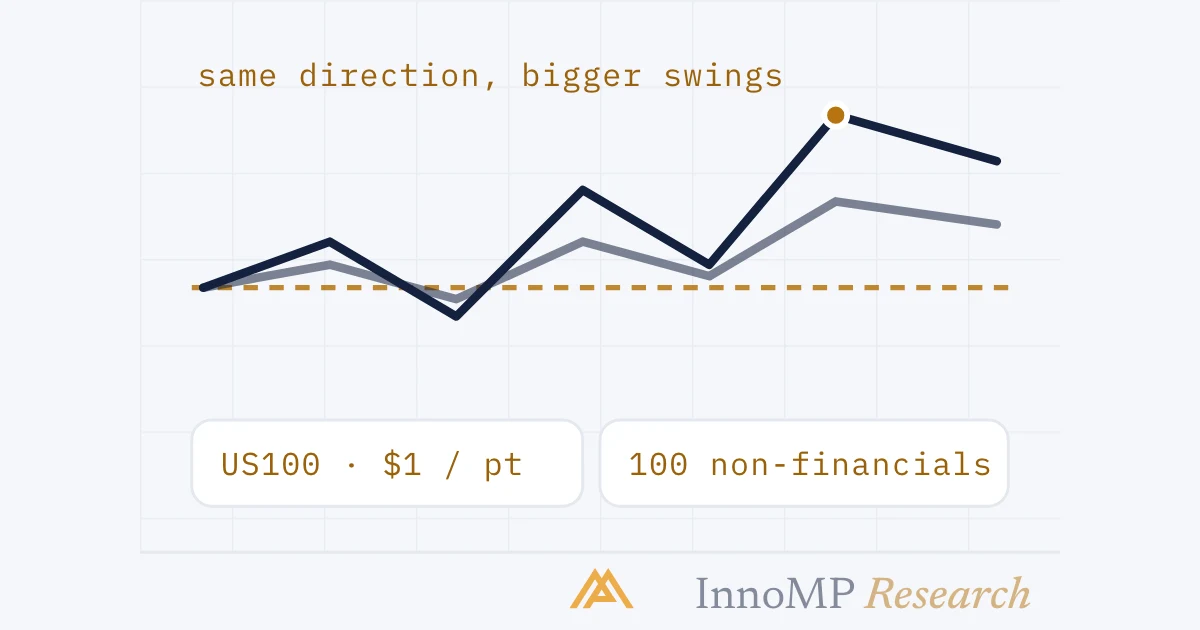
Same direction, bigger swings. Put together, the index tends to move with the S&P 500 and to move further — up more in a rally, down more in a sell-off. That is the one line to remember, and the sizing section is where it lands.
The contract, and the level
US100 quotes the index level in US dollars. The specifics that matter before the first order:
-
Contract size — one lot is one contract on the standard size the calculators here use, so one index point is 1 USD per lot and the 0.1 tick is 0.10 USD. Confirm it in your platform’s contract details.
-
The level, and what it does to the point value. This is the trap. Because the point value is the same as US500’s, the two feel interchangeable. They are not: the Nasdaq-100 trades at several times the S&P 500’s level. Using the indicative prices the calculators carry — roughly 19,800 against 5,600 — a one-percent move is about 198 points on US100 and about 56 on US500. The same lot in each index is therefore about three and a half times the dollar risk in US100 for the same percentage move. Check the ratio at today’s levels; the principle does not change.
-
Leverage — indices carry a maximum of 1:500 on InnoMP. The margin calculator in the order ticket applies it. Leverage sets the margin the position holds; the stop sets what it can lose.
-
Financing and dividends — an index CFD carries overnight swap, and index CFDs are typically adjusted when constituents pay dividends. The arithmetic is in the real cost of a trade; the dividend treatment is in your platform’s contract details.
Sessions and the calendar
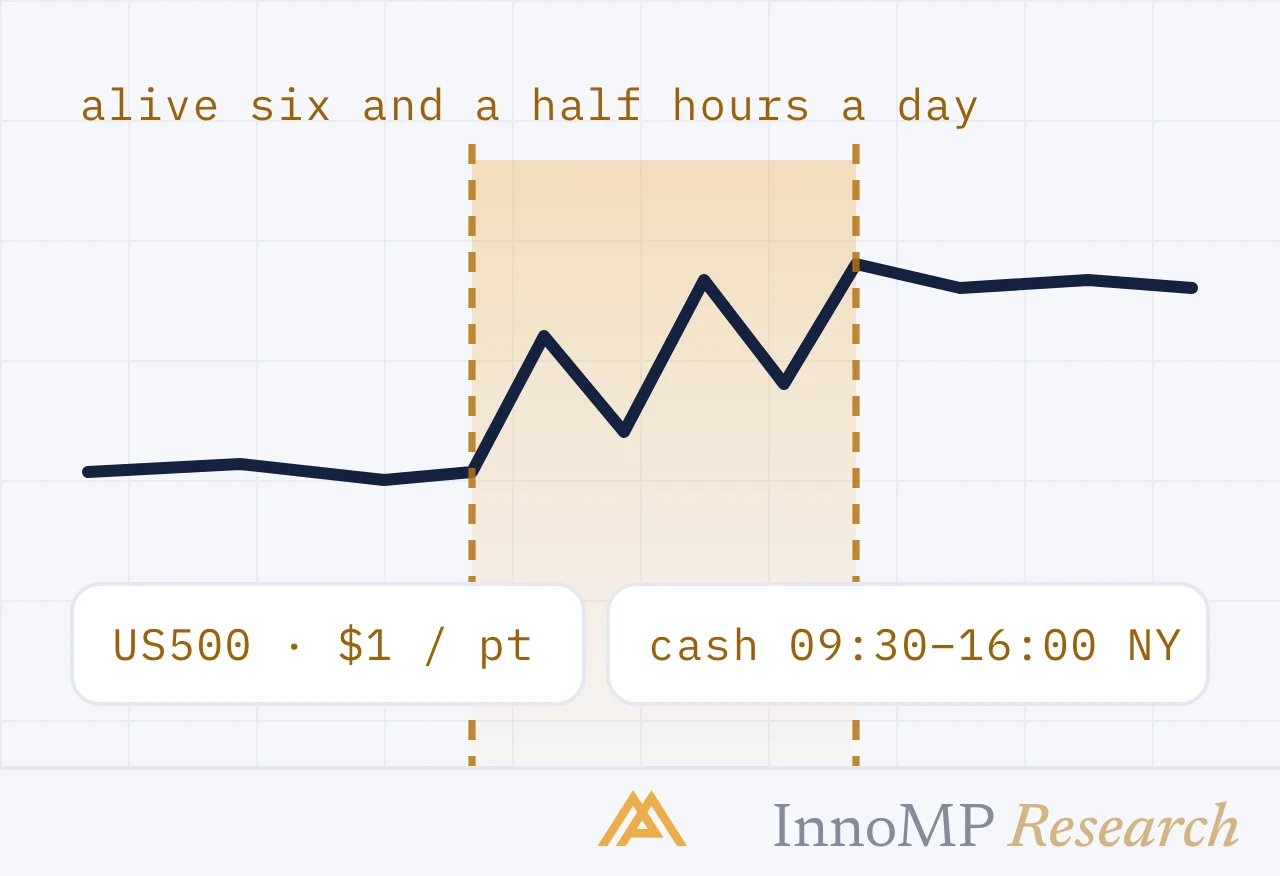
The cash session. The US regular session runs 09:30 to 16:00 Eastern Time, the same hours on Nasdaq as on the NYSE. That is when the underlying stocks trade, when the flows that move the index happen, and when the CFD’s liquidity is deepest. The open prices overnight news; the close prices the day. Outside those hours the CFD tracks futures on a thinner book, and a level made at 03:00 New York carries less weight than one made at 10:00 — the US500 framework covers this and it applies here unchanged.
Earnings, concentrated. The largest constituents report before the open or after the close, never during, and because of the index’s concentration, a single report from one of them can move US100 more than a broad-market event does. Earnings season is the index’s own calendar, and the reaction is the next open.
The Fed. Decisions land at 14:00 New York, inside the cash session, and this is the index that reacts to them most. The scheduled dates are on the economic calendar.
Rebalance days. Weights are rebalanced in March, June and September on the third Friday, the constituents are reconstituted each December, and a special rebalance can be triggered whenever the concentration caps are breached. These are known dates with unusual closing-auction flows in the underlying stocks; they are not trading signals, but a position held into the close on one of them is exposed to something other than the day’s news.
Key takeaway US100 and US500 share a point value and not much else. A stop of 40 points is ordinary on US500 and is a fraction of a normal hour on US100. Size in points from a stop drawn on this index’s chart, at this index’s level — never by carrying a US500 position size across because the ticket looks the same.
Sizing for a higher level
The position-sizing arithmetic is unchanged. A worked example on a 10,000 account risking 1%, with the index near 19,800:
- Risk budget: 100
- Stop distance from the chart: say 120 points — about 0.6% of the level, comparable in percentage terms to the 40-point stop used in the US500 example
- Point value at one contract per lot: 1 USD per point
- Size: 100 ÷ (120 × 1) = 0.83 lots
Run it in the position size calculator — US100 is pre-loaded. Compare it with the US500 example: a similar percentage stop produced 2.5 lots there and 0.83 here. That is the level doing the work. A trader who puts 2.5 lots on US100 because that is what US500 permitted is risking about three times what they wrote down.
Where the stop goes follows the session and the calendar, as on any index: beyond a cash-session level, wider around the Fed and around the largest constituents’ earnings, and with a thought for the third Friday of a rebalance month. Stop placement covers the general case.
A closing framework
Trade US100 with three questions on every idea. What are rates doing, and does the setup agree — this index answers that question loudest? Which session made this level, and is one of the large constituents reporting tonight? What size does a stop in points permit at this index’s level, not at US500’s? The Nasdaq-100 rewards the trader who treats it as the more volatile relative of the S&P 500 rather than as its twin, and it charges the one who reads the shared point value as shared risk.
- The Nasdaq-100 measures 100 of the largest Nasdaq-listed non-financial companies, weighted by modified market capitalisation, per Nasdaq's index methodology.
- No single company may exceed 24% of the index, and companies above 4.5% may not together exceed 48%; a breach triggers a special rebalance.
- Weights are rebalanced in March, June and September and the index is reconstituted each December.
- On the standard one-contract lot, one index point is 1 USD — the same as US500 — but the Nasdaq-100 trades at several times the S&P 500's level, so a one-percent move is several times as many points.
- The US cash session runs 09:30 to 16:00 Eastern Time on Nasdaq and the NYSE alike; the CFD quotes outside it on thinner liquidity.