Correlation between two instruments is the degree to which their price changes move together, measured by a coefficient from −1 to +1 over a chosen lookback. Positive means they rise and fall together, negative that they move opposite, near zero that there is no consistent relationship. It describes a past window, not a rule: it changes with the lookback and over time, and says nothing about which instrument leads. Its use is to know which charts are one trade in disguise, and which can be evidence for each other.
Correlation between two instruments is the degree to which their price changes move together, measured over a chosen period as a coefficient between −1 and +1. It describes a window of the past. It is not a law about the future, and it does not say which instrument is leading.
Every part of this level so far has read one chart, or three timeframes of one chart. This group looks sideways: what other instruments were doing at the same time, and what that is worth. It starts with the number that measures it, because most of what goes wrong with correlation is treating the number as more than it is.
What the number measures
The coefficient is computed on changes, not on levels. Take two instruments, look at how each moved candle by candle over the lookback, and ask how consistently the two moved in the same direction and by proportional amounts. Perfectly consistent gives +1; perfectly opposite gives −1; no consistency gives zero.
Two consequences of “changes, not levels” that catch people out.
Two charts can both trend up for a year and be barely correlated. If their daily moves do not line up — one rises on the days the other falls, and vice versa — the coefficient is low even though both ended higher. Correlation is about the path, not the destination.
A high coefficient does not mean the moves are the same size. Two instruments can move in the same direction with near-perfect consistency while one moves three times as far as the other. The number reports direction and proportion, not magnitude — which matters as soon as a position is sized on it.
Why the number changes
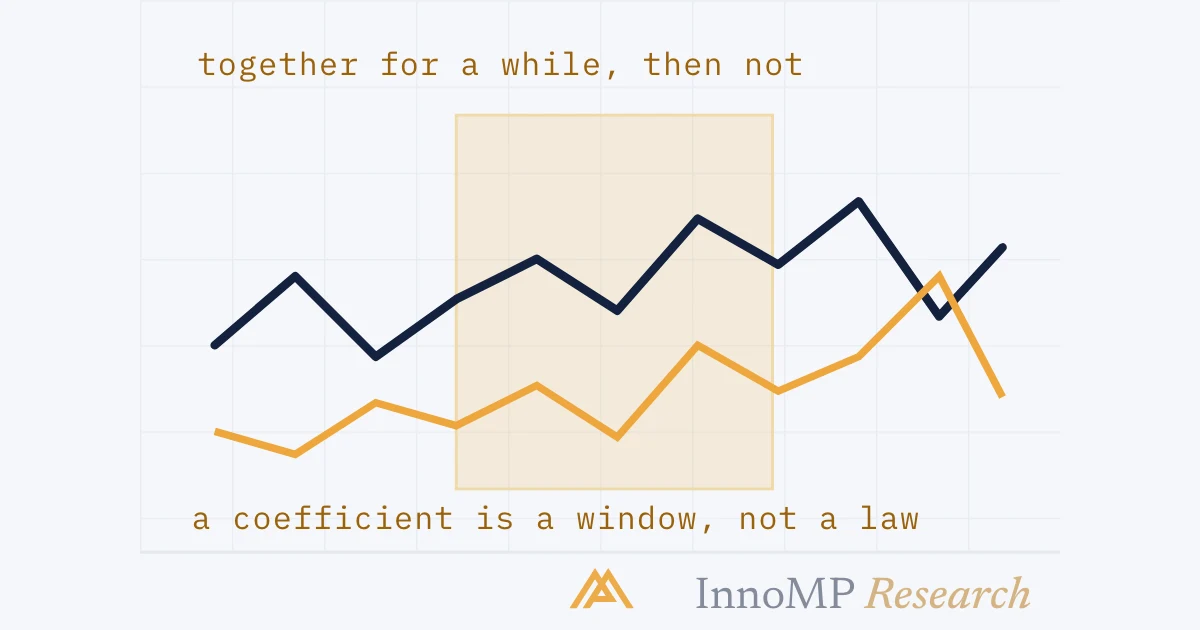
The coefficient is calculated over a lookback period — 20 candles, 50, 250 — and the choice changes the answer. A short window reacts to the last few weeks and swings a great deal; a long window smooths those swings and lags the change when a relationship genuinely shifts. The same two instruments can show a strongly positive 20-day reading and a near-zero 250-day one at the same time.
So a correlation is dated, like a level. “EURUSD and gold are positively correlated” is a statement about some window; without the window it is not a statement at all. The honest form is: over the last N candles, on this timeframe, the coefficient has been X. Anything shorter than that is a memory being treated as a measurement.
Correlation by construction
Some correlations are not temporary, because they are arithmetic. Two currency pairs that share a currency share a leg, and whatever that currency does appears in both.
This is why the major pairs move in blocks. A pip in EURUSD and a pip in GBPUSD are, in part, the same pip: the dollar’s. How much of each pair’s movement is the shared leg and how much is the other currency’s own business is the subject of Part 12 — and separating the two is the subject of Part 13.
Shared legs are also why correlation matters for risk before it matters for analysis. Two positions that share a leg are, to that extent, one position — Part 14.
Correlation by regime
The other kind is temporary by nature. When one theme dominates a market — a central bank’s turn, a shock, a run of risk-taking or of its opposite — instruments with no arithmetic connection move together for as long as the theme lasts, then stop.
The rolling-window figure above is what a regime correlation looks like when measured: it arrives, holds for a while, and leaves. A trader who learned the relationship during the shaded window and kept trading it afterward is trading a memory.
The test is the one the whole level keeps returning to. Is there a mechanism — a shared leg, a shared driver that can be named — or only a coincidence of recent movement? Construction survives the window. Regime does not.
Using it honestly
There are two uses that hold up, and one that does not.
Recognising one trade in disguise. Before opening a second position, ask whether it shares a leg or a driver with the first. If it does, the account has one exposure with two names, and the risk budget has to treat it that way. This is the risk use, and it is the more important one.
Evidence from another instrument’s own structure. A related instrument can be a source of evidence in the confluence count — but only if its own chart is read. EURUSD breaking out while the dollar index breaks down through its own support is two sources agreeing. EURUSD breaking out while the dollar index holds its support is one source, unconfirmed by the other.
The use that does not hold up is prediction. “Gold moved, so EURUSD will follow” treats a coefficient as a lead–lag relationship, which it is not. The number measures joint movement within the same window. Where a genuine lead exists it has to be shown separately, and it usually is not there.
Key takeaway A correlated chart is evidence when its own structure is read and agrees. It is a second position when its exposure overlaps the first. It is never a forecast.
What correlation says, and what it does not
| Correlation says | Correlation does not say |
|---|---|
| How consistently two instruments moved together over the window | Which one moved first |
| Whether the relationship was positive, negative or absent | Why — unless the mechanism is known separately |
| That two positions overlap, if the coefficient is high | How large each move was |
| That a relationship existed in the past window | That it will exist in the next one |
The next part takes the one correlation that is fully arithmetic and fully durable — the dollar leg every major pair contains — and shows how much of any major’s movement it accounts for.
Next: The dollar leg — why the major pairs are often one trade, what the dollar index measures, and how to tell a euro move from a dollar move.
- The correlation coefficient runs from −1, perfect opposite movement, to +1, perfect joint movement; 0 means no consistent relationship.
- Correlation is computed over a lookback window and varies over time; a 20-day and a 250-day reading of the same pair can disagree.
- Correlation measures joint movement, not cause: neither instrument is shown to be leading the other.
- Two instruments that share a leg — the same currency, or the same driver — are correlated by construction and are one exposure when traded together.
- A correlated instrument is independent evidence only when its own structure is read, not when its price is assumed to follow.