Volatility clusters: large price changes tend to be followed by more large changes, and quiet by quiet, so a market spends stretches in a high regime or a low one. A regime is read by comparing the current ATR or realised volatility with the instrument's own history. The regime changes what every earlier rule means: a stop distance, a target in pips, a session's usual range and a setup's expectancy were measured in some regime and carry into another only if they were scaled to it.
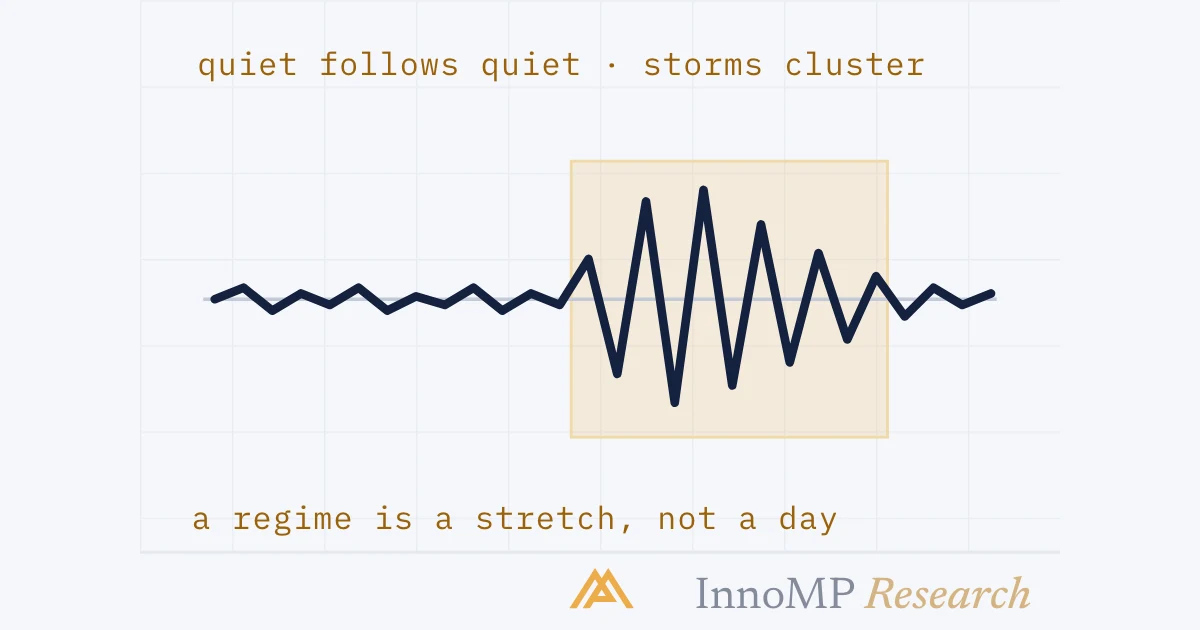
Volatility clusters. Large price changes tend to be followed by more large changes and quiet periods by more quiet, so a market spends stretches of time in a high-volatility regime or a low one rather than varying at random from day to day — and every rule written in pips was written in one of those regimes.
Part 8 ended on the lookback: the window decides what a volatility reading describes. This part is why the window is more than a technicality. Volatility has memory, and the stretch of memory the market is currently in is the regime.
Large follows large, small follows small
The observation is old and it is one of the most robust in financial statistics. Robert Engle, in the Nobel lecture for the work that modelled it, lists three ubiquitous characteristics of returns from holding a risky asset: they are almost unpredictable, they have surprisingly large numbers of extreme values, and both the extremes and the quiet periods are clustered in time. He calls the three unpredictability, fat tails and volatility clustering — and puts the last one plainly: when volatility is high it is likely to remain high, and when it is low it is likely to remain low.
Two things about the figure that carry the rest of the part.
The clusters are in size, not sign. Inside a loud stretch the bars point both ways. Clustering is a statement about how much price is moving, not about which way — the same distinction Part 8 drew for ATR. A high regime is not a bearish one.
The quiet is clustered too. The stretches between the shaded windows are not merely “not loud”; they are persistently quiet, and a rule that is right for them is wrong for the windows. That is the asymmetry that costs money, because the quiet stretches last longer and the rules get written in them.
What a regime is
A volatility regime is the current level of an instrument’s volatility relative to its own longer history: high, normal or low for that instrument. The comparison is with itself, because the units are its own — an ATR of 80 pips is a high regime for one pair and a quiet one for another.
Three readings, in increasing order of effort.
Short against long. A 14-bar ATR above the 100-bar ATR says volatility is above its recent norm; below it, under. Cheap, always available, and the least stable — the short window was designed to react.
Where in the year. Take the last year of daily ATR readings and ask where today’s sits — top third, middle, bottom third. Slower, and it answers the question a regime actually asks: for this instrument, is this loud?
Realised volatility against its own history. The same reading in percent rather than pips, which adds the ability to compare the regime across a correlated book.
None of the three is a signal. A high reading is a description of the recent past, and the only thing clustering promises is that the recent past is a reasonable guess about the near future.
Key takeaway The regime is a comparison of an instrument with itself. It is read from the lookback the setup trades on, and the one fact it rests on — that volatility persists — is what makes reading it worth the trouble.
What the regime does to a rule written in pips
Every earlier level wrote rules in the instrument’s price units, and every one of them was written in some regime. Move to another regime and the rule keeps its number and loses its meaning.
The list of things that change is the list of things the course has taught.
| Written in pips | What it was, in the regime it was written | What happens in another |
|---|---|---|
| Stop distance | Beyond the noise | Inside it, or absurdly far outside |
| Target distance | 2R or 3R | A different R, and a different hit rate |
| The buffer beyond a swing | Enough to survive a sweep | Not enough, or wasteful |
| A session’s usual range | The Asian box, the London leg | A box that is no longer a box |
| A breakout’s follow-through | A wide candle | An ordinary one |
| The setup’s record | Expectancy at that volatility | A number about a different market |
The last row is the expensive one. A setup tested through a year of low volatility has a record that says nothing about the setup — it says something about the setup at that volatility. Its stop was outside the noise every day of the test, and the first month of a loud regime is the first month its stop is inside it. The fix is the subject of Part 10: write the rules in volatility units and the record carries.
Persistence, and the step
Because volatility clusters, regimes persist. That is what makes them useful. What makes them dangerous is how they change.
The step is not forecastable — Engle’s first characteristic of returns is that they are almost unpredictable, and the timing of a shock is the most unpredictable thing about it. The persistence after the step is the forecastable part. A shift into a high regime is a reason to expect a high regime to continue, and to re-read every rule immediately rather than waiting to see whether the first loud week was an exception. Because of clustering, it usually was not.
The reverse step — a loud regime going quiet — is slower and more often gradual, which is why the Chandelier and its relatives use a longer ATR window than the entry stop does: the exit is meant to remember the regime a little longer than the entry does.
Three questions before a trade
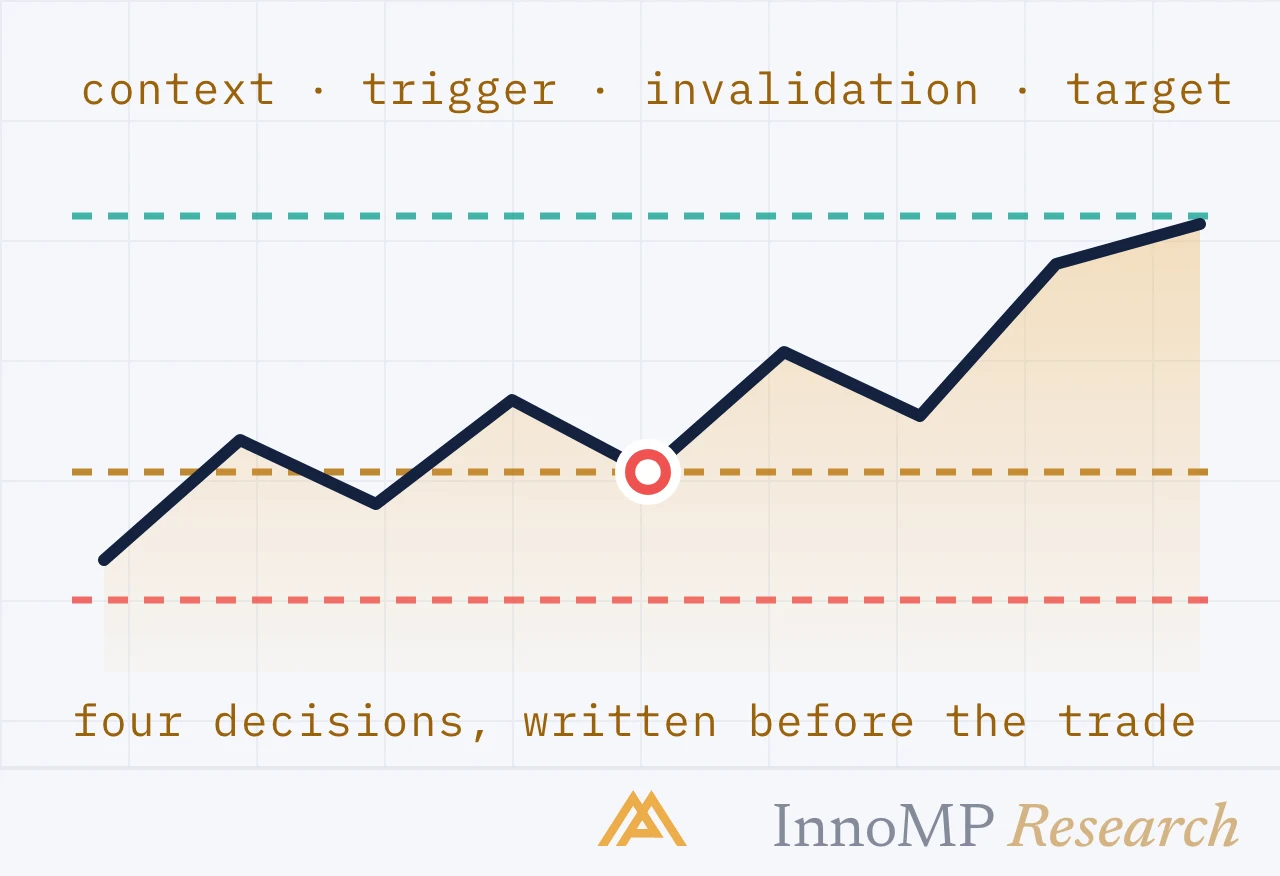
The check sits in the setup’s context stack from the Intermediate level, next to the bias and the level, and it is asked on the same timeframe. Its answer is not a reason to trade or not to. It is the number that the next part multiplies everything by — the stop, the target, the trail, and through the stop, the size — so that a rule tested in one regime is the same rule in another.
Next: Sizing and stops by volatility — the stop as a multiple of ATR, the position sized from it, and what that keeps constant when the regime changes.
- Volatility clusters: large changes tend to be followed by large changes, small by small.
- Robert Engle's Nobel lecture describes financial returns as having extreme values, with both the extremes and the quiet periods clustered in time, and states that when volatility is high it is likely to remain high, and when low to remain low.
- A volatility regime is the current level of ATR or realised volatility relative to the instrument's own longer history.
- Regimes persist for stretches and change, often abruptly, around events.
- A stop, a target and an expectancy measured in one regime are valid in another only if they were expressed in volatility units.