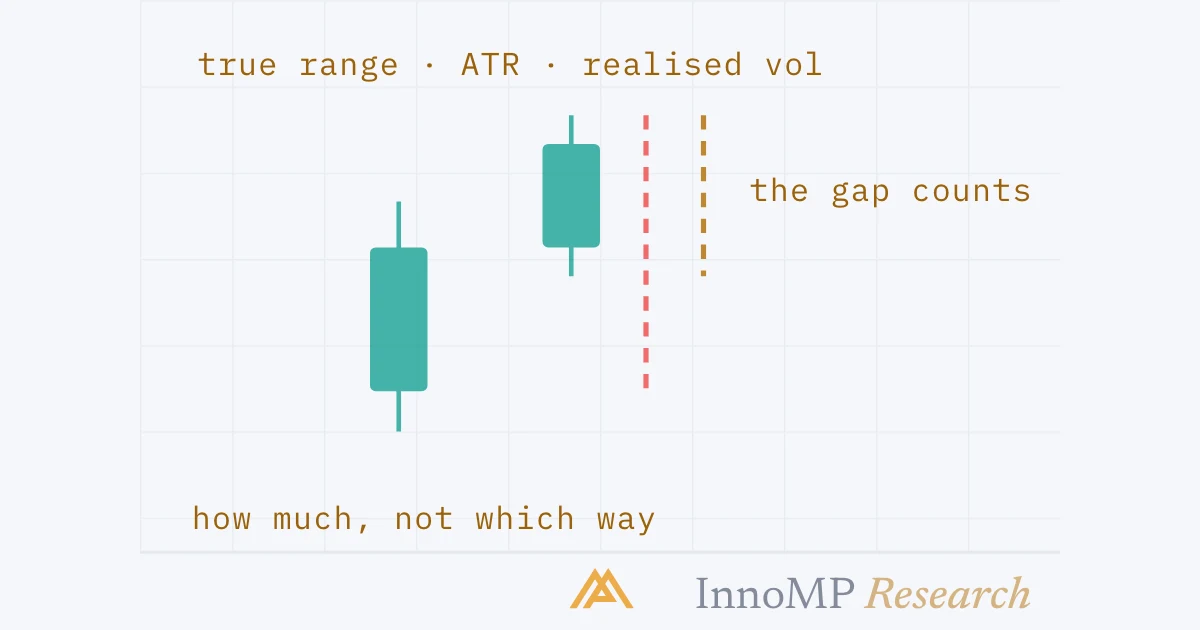
Volatility is the size of price movement over a period, regardless of direction. True range measures one bar: the greatest of the bar's high minus low, high minus the previous close, and low minus the previous close, so gaps count. Average True Range averages true range over a window, usually 14 bars: a typical move in price units. Realised volatility is the standard deviation of returns over a window, a percentage comparable across instruments. All three describe the recent past, not the next move's direction.
Volatility is the size of price movement over a period, regardless of direction. It is measured per bar by true range, over a window by Average True Range in price units, or as the standard deviation of returns in percent — and every one of those is a description of the past, not a forecast of the next move.
Two groups of this level have been about the book — what sits in it and what happens when price reaches it. This group is about the scale of everything that happens: how much price moves, why that changes, and how a position is sized when it does. It starts with the measurement, because the Foundations treatment of ATR gave the idea and this level needs the arithmetic.
True range: one bar, three distances
The range of a bar is its high minus its low. That misses one thing: the distance from where the previous bar closed. A bar that opens far above the last close and then goes nowhere has a small range and a large move.
True range is the greatest of three distances: the bar’s high minus its low; the bar’s high minus the previous close; and the bar’s low minus the previous close, taken as positive numbers. When there is no gap the first is the largest and true range is just the range. When there is a gap, one of the other two is larger, and the gap is counted.
That matters most where gaps are routine — the Sunday open, a daily candle that begins after the rollover, a news release inside a bar. A measure that ignored them would say the market was quiet on exactly the days it was not.
ATR: the average over a window
Average True Range is true range averaged over a window. J. Welles Wilder, who developed it, used 14 periods and a smoothing that gives recent bars more weight; the platform’s default is the same.
Two properties decide what ATR is for.
It is in price units. An ATR of 80 pips on EURUSD means a typical hourly bar, say, has moved 80 pips. That is directly usable as a stop distance, a target distance, or a buffer — the uses Foundations sketched and Part 10 makes precise. It is not comparable across instruments: 80 pips of EURUSD and 80 points of an index are unrelated quantities.
It is not direction. StockCharts’ description says it in one line — ATR does not indicate price direction, just volatility — and the point bears repeating because a rising ATR is often read as bearish. It is not. It rises in a sharp rally exactly as it rises in a sharp fall.
Realised volatility: the spread of returns
The third measure works on returns rather than ranges. Take each bar’s percentage change from the last, and measure how spread out those changes are around their average. That spread — the standard deviation of returns over the window — is realised volatility, and it is quoted as a percentage, usually annualised.
Because it is a percentage of price, realised volatility can be compared across instruments. A currency pair at 7% and an index at 18% are on the same scale; two ATRs in different units are not. That is the measure a correlated book needs when its positions are in different markets, and the one the regime reading of the next part uses when it asks whether an instrument is loud or quiet for itself.
Which measure, for which job
| Question | Measure | Why |
|---|---|---|
| How far away should the stop be? | ATR | The answer is in pips, on this chart |
| How big can the position be for 1%? | ATR, via the stop | The calculator takes a distance in price |
| Is this instrument loud or quiet right now? | Either, against its own history | The comparison is with itself |
| Is gold moving more than EURUSD? | Realised volatility | Two units need one scale |
| How much of the book’s risk is in one theme? | Realised volatility | Positions in different markets |
Key takeaway ATR is the measure for one chart, in that chart’s units. Realised volatility is the measure for comparing charts. Both say how much; neither says which way; and both are only as current as their lookback.
The lookback decides what you measured
Every one of these numbers is computed over a window, and the window decides what it describes — the same rule the Intermediate level applied to correlation.
A 14-bar ATR describes the last 14 bars. After a news spike it doubles within a few bars and halves again within a few more; a 100-bar ATR barely moves on the day and stays elevated for weeks. Neither is wrong. A stop sized from the first will be tight again a day after the spike; one sized from the second will stay wide for a month.
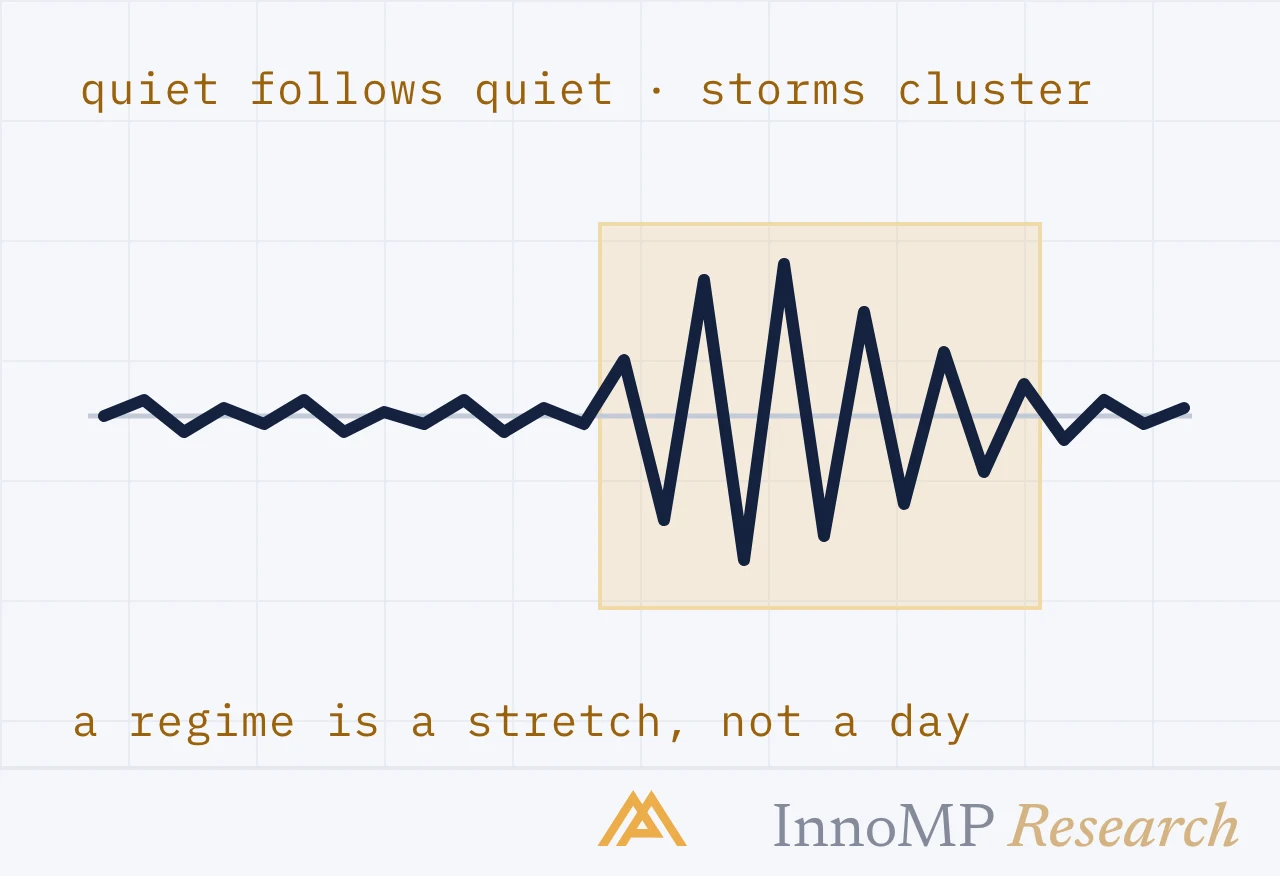
Which window a setup uses is part of the setup, like its trigger, and it is tested with it. What the next part adds is the reason the choice matters so much: volatility does not wander at random around a fixed level. It clusters, and the window is the instrument’s memory of the cluster it is in.
Next: Volatility regimes and clustering — why quiet follows quiet and storms come in clusters, how to read which regime you are in, and what that changes.
- True range is the greatest of high minus low, high minus previous close, and low minus previous close, so gaps are counted.
- Average True Range, from J. Welles Wilder, averages true range over a window — 14 periods by default — and is quoted in price units.
- Realised volatility is the standard deviation of returns over a window, quoted as a percentage and comparable across instruments.
- ATR indicates volatility, not price direction.
- A volatility reading describes a window of the past; its lookback decides what it describes.