Relative strength compares one currency against several counterparts at once, to find which is strongest and which weakest over a chosen window. A pair is a ratio of two currencies, so the pair that moves most cleanly puts the strongest leg against the weakest: both legs push the same way. Every pair is compared on the same timeframe over the same window; the price relative — one instrument divided by another — is the same idea for any two instruments. It chooses the pair. The top-down procedure still decides when.
Relative strength across pairs compares one currency against several counterparts at once, over the same window, to find which currency is strongest and which is weakest. The pair that puts the strongest against the weakest is the one whose two legs push the same way.
Part 12 separated a pair’s move into the dollar’s part and the other currency’s part. This part does that for every currency at once — and uses the result to choose which pair to take through the procedure of Part 1, rather than defaulting to whichever chart happened to be open.
A pair is a ratio
EURUSD is the euro divided by the dollar. It rises when the euro strengthens, when the dollar weakens, or both — and the chart alone does not say which.
That is the whole argument in one figure. A pair’s move is the difference between its legs. Two legs pushing the same way add; a strong leg against another strong leg cancels; a weak leg against a weak leg cancels. The trend a chart shows is only as clean as the disagreement between its two currencies.
Ranking currencies against several counterparts
To know what a leg is doing on its own, read it against more than one counterpart. The euro against the dollar says something about both; the euro against the dollar, the pound, the yen and the franc over the same window says something about the euro.
The method needs three things held constant, or the ranking is meaningless.
The same timeframe. A currency can be the strongest of the week and the weakest of the last four hours. The ranking is read on the trading timeframe from the procedure, so that it answers the question that chart is asking.
The same window. Every currency is measured over the same number of candles. Twenty candles of the trading timeframe is a common choice; the number matters less than using one number for all of them.
Enough counterparts. A currency that is up against one other has had a good pair. A currency that is up against five is strong. Reading EUR against USD, GBP, JPY, CHF and AUD is enough to say which; the dollar index is the same idea done for one currency by construction.
The price relative
For instruments that are not already quoted against each other, the comparison is drawn as a ratio. StockCharts defines the price relative as one security’s price divided by another’s: it rises when the first is outperforming the second and falls when it is underperforming.
A currency pair is a price relative — the base divided by the quote — which is why the currency ranking above needs no extra construction. The ratio becomes a tool of its own when the question is between two instruments the platform does not quote against each other: one index against another, gold against silver, one stock CFD against its sector. It answers the same question the ranking does — which of the two is carrying the move — and it is read with the same structure tools as any chart, because it is one.
Strongest against weakest
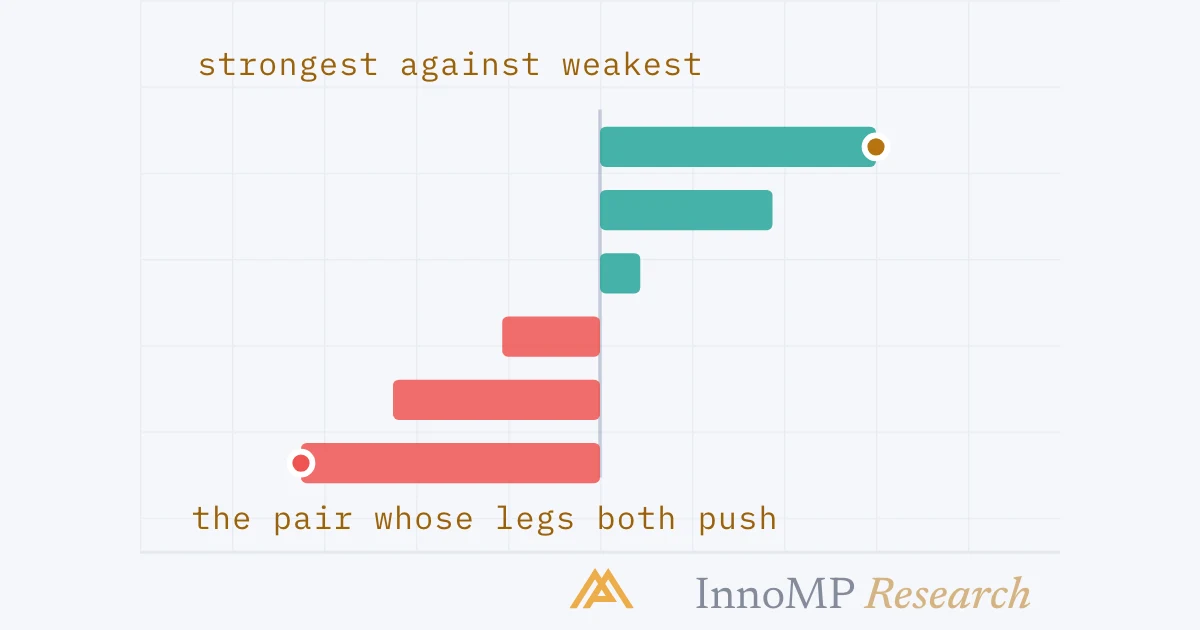
Put the ranking to work and the reason for it appears on the chart.
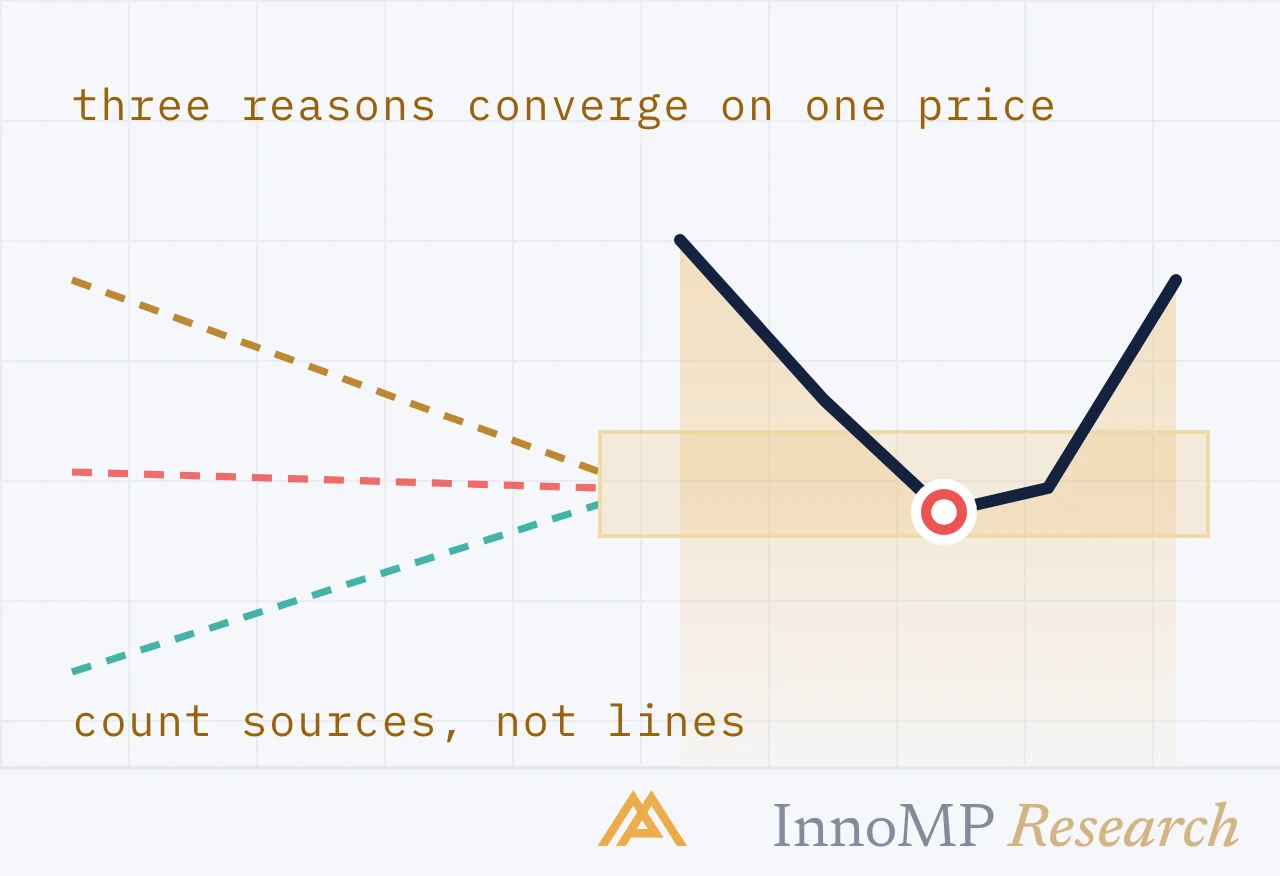
This is the practical payoff. The confluence count from Part 3 asks for independent reasons; the ranking supplies one that no single chart contains. A pair that is strongest-against-weakest and has a daily bias, a level and a trigger has a reason from the cross-section of the market on top of its own structure. A pair that is strong-against-strong has a chart that will fight the procedure at every step, however good its level looks.
Key takeaway Relative strength answers “which pair?” It is asked before Step 1, and it is not asked again until the window rolls. Everything after that — bias, level, setup, trigger — is the procedure, unchanged.
Where it fits, and where it fails
| Trading style | Ranking timeframe | Window | Re-ranked |
|---|---|---|---|
| Swing, days | Daily | 20 daily candles | Weekly |
| Intraday, hours | 1-hour | 20 hourly candles | Each session |
Three ways the ranking misleads.
Rankings rotate. The currency at the top of the table is the one that has already moved most. It got there by rising, and a ranking read late is a list of what has happened. The ranking chooses a pair to watch; the procedure still waits for a pullback and a trigger, exactly as Part 1 requires. Buying the top of the table because it is the top is the FOMO Foundations described, with a spreadsheet.
One event can make a ranking. A currency that jumped on a single release is strong for the window and may be nothing afterward. The ranking says what moved; the calendar says whether it was one candle.
Two windows give two rankings. The daily table and the hourly table will disagree, and both are right about their own window. The one that counts is the one on the trading timeframe — the same rule that settled timeframe conflicts in Part 4.
The ranking also has a use that has nothing to do with choosing a trade: it shows when two pairs already held are the same bet. Two long positions in the top currency against two different weak ones are one long in that currency, twice — which is where the next part begins.
Next: Correlated positions and risk — when two trades are one, how exposure adds up across pairs that share a leg, and how to size for it.
- A currency pair is a ratio, so its move is the difference between what its two legs are doing.
- Relative strength ranks currencies by comparing each against several counterparts over the same window.
- The cleanest trend is the pair that puts the strongest currency against the weakest, because both legs push the same way.
- The price relative — one instrument divided by another — rises when the first outperforms and falls when it underperforms.
- Relative strength chooses which pair to trade; the top-down procedure still decides when.