A daily candle runs from one server midnight to the next, and MetaTrader charts are stamped in the broker's server time, not the reader's local time. Retail spot forex ends its trading day at 17:00 New York — the weekly open and close and the rollover sit there, as does the daily break in exchange-traded FX. A server whose midnight is 17:00 New York cuts five daily candles a week that match the convention; any other offset adds a Sunday stub and shifts every daily high, low and close.
Server time is the clock of the broker’s trading server, and it stamps every candle on a MetaTrader chart. A daily candle runs from one server midnight to the next — so where the server puts midnight decides what a “day” is.
Every reference level in Part 9 was read from a daily candle. The Step 1 bias in Part 1 was read from daily structure, and the two events that end a trend in Part 4 were daily closes. None of that said which twenty-four hours a daily candle covers. This part does, because two traders looking at the same market on the same date can be looking at different daily candles, and both charts are correct.
Charts run on server time
The platform’s own documentation is plain about it. In MetaTrader 5 the time on the horizontal axis of every chart is the server’s time, and the quote times in Market Watch are given in the trading server’s time zone — not the computer’s local clock. The reader’s own time appears nowhere on the chart.
Finding the server’s offset takes a minute: compare the timestamp of the newest candle with your own clock, then with New York’s. The difference is fixed until a daylight-saving change, and it is worth writing down, because everything below depends on it.
What a “day” is
There is no exchange to declare a close in spot forex, so the day’s boundary is a convention. Exchange-traded FX supplies the anchor: CME’s currency futures trade from Sunday evening to Friday afternoon with a break each day beginning at 4:00 pm Chicago time — which is 5:00 pm in New York. Retail spot forex uses the same New York hour as the end of its trading day. The week opens at 17:00 New York on Sunday, closes at 17:00 New York on Friday, and the rollover — the widened spreads and the swap — falls at 17:00 New York every day between.
That is the convention. The candle on a given chart follows the server, and the two coincide only when the server’s midnight is 17:00 New York.
Where the server puts midnight
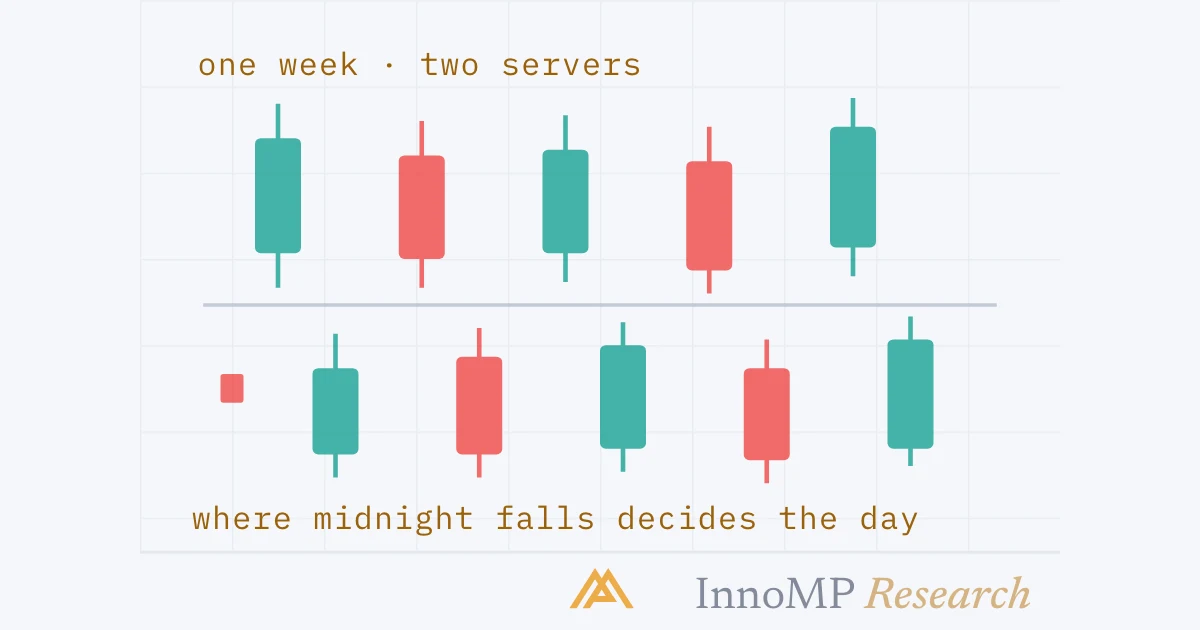
A server whose midnight coincides with 17:00 New York cuts the week into five daily candles, each one a full trading day from rollover to rollover. A server on any other offset cuts it differently.
Two things happen on server B. The week’s first hours — from the Sunday 17:00 New York open to the server’s next midnight — form a Sunday candle: short, thin, and a day of its own as far as the platform is concerned. And every daily candle after it straddles two of server A’s, so its open, high, low and close are all different prices.
Neither server is wrong. Each has cut the same continuous market at a different hour. But the cut is not cosmetic.
What moves with the cut
Anything computed from daily candles inherits the server’s midnight.
| Built on daily candles | Depends on the cut | Because |
|---|---|---|
| Previous day’s high and low | Yes | Different 24 hours, different extremes |
| Daily open | Yes | A different first price |
| Pivot points | Yes | Fed a different high, low and close |
| Daily ATR, daily moving averages | Yes | Every input candle differs |
| Daily candlestick patterns | Yes | A hammer on one chart is two plain candles on another |
| 4-hour candles | Yes | They start at server midnight too |
| 1-hour and shorter candles | No, on whole-hour offsets | Hour boundaries line up across servers |
The last row of the table is the consolation. Structure read on the 1-hour chart — the swings, the triggers of Step 3 — lines up across platforms whose offsets are whole hours, because the hour boundaries are the same everywhere. It is the daily and 4-hour charts, the ones the bias and the levels come from, that differ.
Key takeaway “The daily closed above the level” is a statement about a server, not about the market. Before comparing a daily read with anyone else’s — a colleague’s, a commentary’s, a generative answer’s — establish that the two charts cut the day at the same hour.
Daylight saving
New York changes its clocks in March and November, so the conventional cut moves in UTC: 17:00 New York is 22:00 UTC in winter and 21:00 UTC in summer.
A server that follows New York’s clock changes keeps its daily candle aligned with the convention all year. A server on a fixed offset from UTC is aligned for part of the year and an hour out for the rest — and for those months its “daily” candle quietly contains an hour of the next conventional day. The number of candles per week may change with it: a server aligned in winter can gain a Sunday stub in summer.
What to do with this
Know your offset. Compare the newest candle’s timestamp with New York, once, and again after each clock change. It takes a minute and it decides what every daily reference level on the chart means.
Prefer the conventional cut when comparing. Most published daily levels, most commentary and most other traders’ charts assume the 17:00 New York day. If your server does not, the previous-day high someone else is quoting is not the one on your chart.
Be consistent above all. The procedure in Part 1 works on any server, as long as the same server’s daily close is used for the same test every time. A bias read from server A’s close and a level read from server B’s are two different days pretending to be one.
Distrust the Sunday candle. Where it exists, it is a few thin hours dressed as a day. Reference levels drawn from it — Monday’s “previous day’s high” — are the low-participation readings Part 7 warned about, and pivot points fed with it are arithmetic on noise.
Where this group ends
Three parts, one clock. The day is structured by three opens, and the Asian range is the first thing the map has on it. Each day and week leaves reference levels that are populated because they are watched. And underneath both, the daily candle everything is read from begins and ends where a server says it does — which is worth checking before a daily close is allowed to change a bias.
The next group leaves the single chart and asks what other instruments were doing at the same time.
Next: Correlation between instruments — what moves together, for how long, and what the coefficient can and cannot tell you.
- The time axis of every MetaTrader 5 chart is the broker's server time, not the reader's local time.
- CME FX futures trade Sunday to Friday, 5:00 pm to 4:00 pm Chicago time, with a daily break from 4:00 pm Chicago — 5:00 pm New York.
- Retail spot forex uses 17:00 New York as the end of its trading day; the weekly open, the weekly close and the rollover all sit there.
- A server whose midnight falls at 17:00 New York produces five daily candles a week; other offsets produce a sixth, short Sunday candle.
- Daily highs, lows, opens and closes — and every level or indicator built from them — depend on where the day is cut.