A decision table lists a setup's conditions as rows and its rules as columns, each column giving one combination of condition values and the action it produces — enter, wait, skip. A full table has a column for every feasible combination, so a market state with no column is a decision made on the spot, and two columns with the same conditions and different actions are a contradiction. Building the table from the written setup is how a discretionary process becomes one the record can measure.
A decision table lays a setup’s conditions out as rows and its rules as columns, so that every combination of conditions the market can present has a column, and every column has an action. The written setup of the Intermediate level said what to do when everything lined up. The table says what to do when it does not — which is most of the time.
The last group of this level is about running a setup that has passed the tests of the previous one: turning its rules into a table, the table into alerts and orders, and the running system into something that is reviewed on a schedule and, when the record says so, stopped. It begins with the table because everything after it consults the table.
Prose leaves gaps
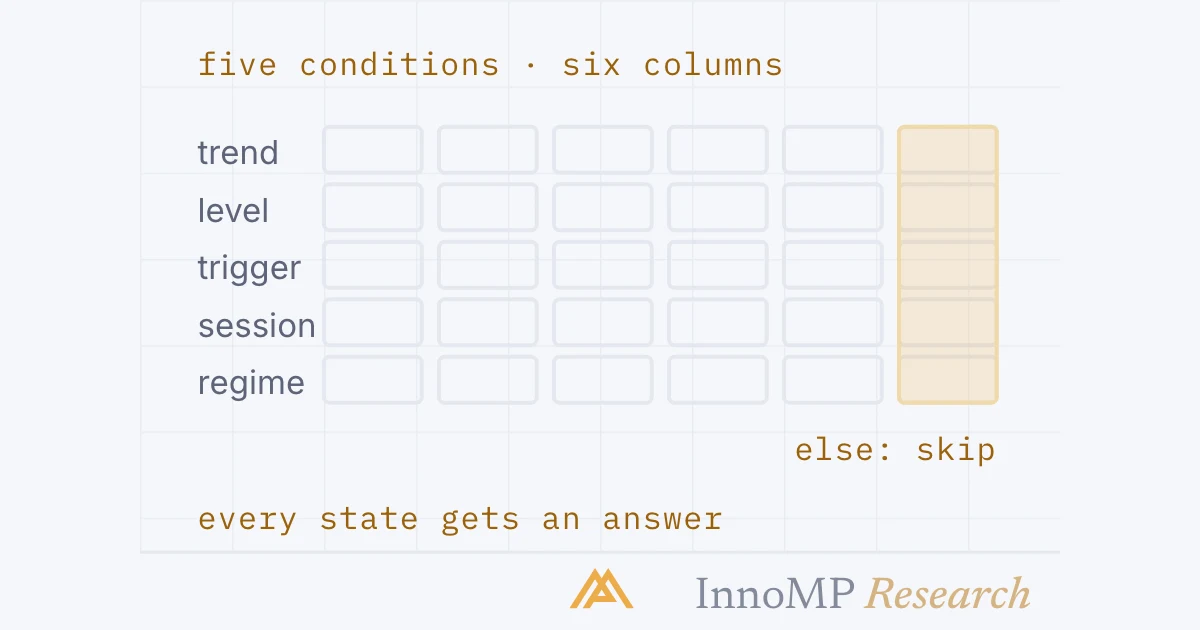
The Intermediate level’s setup card has four parts — context, trigger, invalidation, target — and it describes one state of the market: the one in which all of them are present. That is one combination. With five yes-or-no conditions there are thirty-two.
The thirty-one unwritten states are not rare. Trend up, level reached, trigger closed, but the session is Asian; trend up, level reached, session right, but the candle closed back through the level; everything right and the regime loud. Each arrives on the chart, each requires a decision, and the prose has none — so the decision is made on the spot, and the record that was supposed to measure the rules measures the trader instead.
The table
The fix is a technique from outside trading. The ISTQB Foundation syllabus, the standard text for software testers, describes a decision table this way: the conditions and the resulting actions form the rows; each column corresponds to a decision rule that defines a unique combination of conditions along with the associated actions. Conditions are marked true, false, or a dash for irrelevant; an X in an action row means the action occurs.
A decision table is this grid: the setup’s conditions down the side, one column per rule, one action per column. A decision rule is one column — a unique combination of condition values and the action it produces. The card was rule 1. Rules 2 to 5 are the states the card left to the moment: the trigger not yet closed (wait for it), the wrong session (skip), the loud regime the volatility group taught the setup to recognise (skip), the higher-timeframe trend absent (skip, and nothing else needs checking — the dashes).
Two things the table is not. It is not a replacement for judgement about the conditions themselves: whether the trend is up on the higher timeframe is still read from the chart, by the method the Intermediate level gave, and the table does not decide that. And it is not a strategy: it contains no new idea. It contains the old idea with the gaps closed.
Every combination, then fewer
The syllabus is specific about completeness: a full decision table has enough columns to cover every combination of conditions, and the number of rules grows exponentially with the number of conditions. It is also specific about the remedy — merge the columns in which some conditions do not affect the outcome into one, marked with dashes.
Five conditions is a small setup. A setup with the Intermediate level’s full stack — trend, level, pullback depth, volume confirmation, session, regime, correlation check — has seven, which is a hundred and twenty-eight combinations, and the merging is what makes that a page rather than a book. But the merging is also where the syllabus’s warning about complexity and Part 13’s meet: every condition added is a knob, and a table with many conditions and few trades per column is a table that has been fitted. The number of columns a record can support is the sample-size arithmetic of Part 11, applied per column.
Gaps and contradictions
The syllabus names the two things the table finds that prose hides: gaps and contradictions.
A gap in a trading table usually means a condition that is missing, not a column: the table has no row for scheduled news, so the state “everything true and a release in ten minutes” looks like rule 1, and the economic calendar lesson from Foundations was never written into the rules that were supposed to contain it. Adding the row doubles the combinations and adds one column. A contradiction is usually two rules from two different weeks — skip the Asian session, written after a loss; trade the Asian range break, written after a win — which the table shows as the same column with two actions. The prose version of the setup held both without noticing.
The else rule
The table does not need a column for every rare state, because it can have one column for all of them. The else rule is the last column: every combination not matched by the others, with the action skip. It makes the table complete without making it long, and it turns the most common decision the system makes — nothing — into a rule rather than an absence.
The else count is the number the journal of the psychology series asked for without a name: decisions recorded, not just results. A system whose else column is consulted forty-six times a month and obeyed forty-six times is being run. One whose else column is obeyed forty times and overridden six is producing six trades the record cannot attribute to any rule — and the next two parts are about counting exactly that.
Key takeaway Write the conditions as rows and enumerate every combination once. Give each a column and an action, merge the columns where a condition does not matter, and close the table with an else rule whose action is skip. What is left is a setup that has an answer for every state of the market, and a record that measures the answers rather than the trader.
What the table does to the record
Everything the previous group measured assumed a record produced by rules. The table is what makes that assumption true. Each trade in the record is now a column — rule 1, taken; rule 2, waited and then taken or not; else, skipped — and the expectancy, the drawdown distribution and the trial log describe columns, not moods.
That last point is the one to hold on to. The table is the concrete form of the thing Part 13 said had to be counted: a version of the rules. Editing a column — tightening the session condition, adding the news row — is a new version, and the honest response is an entry in the trial log and a record that starts again from that date. A table that is edited every week has no record; it has a trial log with weekly entries, which is what Part 13 called overfitting done on a schedule.
The next part is about the table’s first column in practice: how the machine tells the trader that it may be time to read the table, and what the order looks like when the answer is enter.
Next: Alerts and execution rules — what the machine watches, what the trader decides, and the parts of the order fixed before the alert exists.
- A decision table's conditions and actions form its rows; each column is a decision rule giving a unique combination of conditions and the actions that follow (ISTQB Foundation Level syllabus).
- A full decision table has enough columns to cover every combination of conditions, and the number of rules grows exponentially with the number of conditions.
- Decision tables help find gaps and contradictions in a set of rules: combinations that were overlooked, and combinations that produce two different actions.
- Five yes/no conditions give 32 combinations; most collapse into a handful of rules once conditions that do not affect the outcome are marked irrelevant.
- The column whose action is no trade is a rule like any other, and its count belongs in the record.