Testing a setup by hand means replaying a chart candle by candle, applying the written rules exactly, and recording every trade they would have taken before any money is risked. The record gives a win rate, an average win and loss, an expectancy and the worst run of losses. The numbers mean something only once the sample is large enough that a few trades cannot move them, and only if losers were recorded as carefully as winners. A forward test on a demo account is the same record, kept in real time.
A manual backtest replays a chart candle by candle, applies a setup’s written rules exactly, and records every trade they would have taken — before any money is risked. The record is the setup’s first evidence, and the size of the record decides how much it is worth.
This is the last part of the level, and it is where the other seventeen are checked. A setup that has been written down in the form of Part 15 can be tested; the test is slow, unglamorous, and the only thing that separates a setup from an opinion about one.
The replay
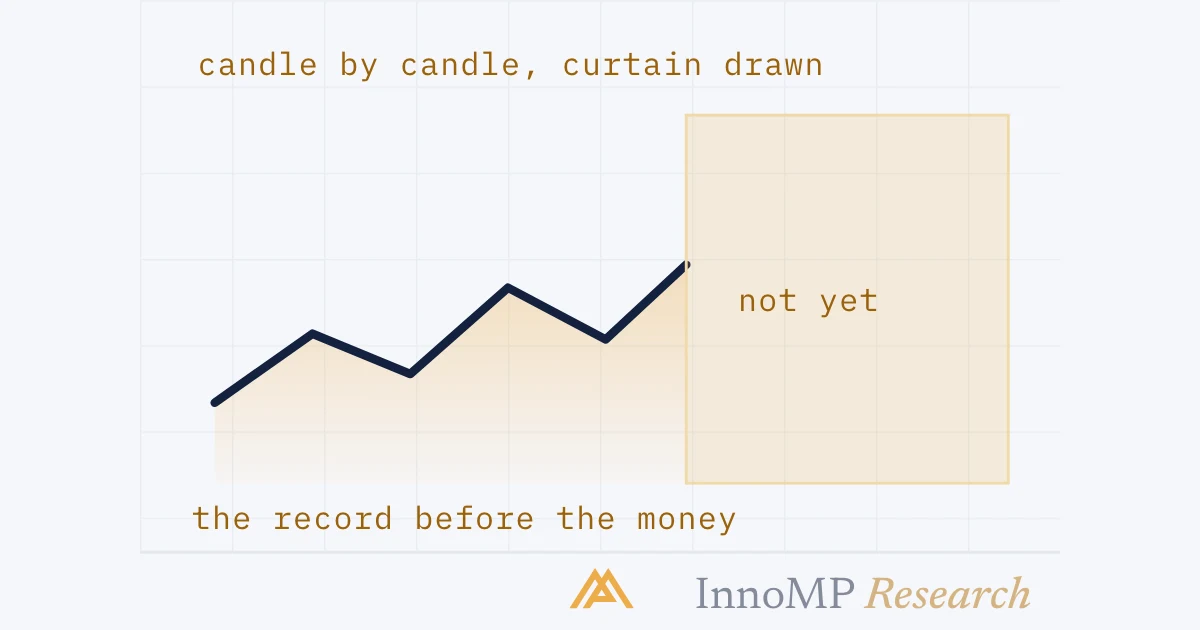
The method is simple and the discipline is not. Cover the chart. Reveal one candle. Ask whether the setup’s rules fire — the context stack, the trigger — and if they do, write the trade down: entry, stop, target, size in R. Only then reveal the next candle, and follow the trade to its stop or target as the candles arrive.
The thing the curtain prevents is look-ahead bias: letting the next candle into a decision that is supposed to be made before it. Without the curtain, every trigger that led to a winner looks obviously valid and every one that led to a loser looks obviously marginal, and the record ends up measuring hindsight — the bias Foundations described, with a scrollbar. Platforms have replay tools that step candles forward; a hand over the screen works too. What does not work is scrolling.
The record
One row per instance the rules fired. Not one row per trade taken — per instance the rules fired, including the retests that never filled from Part 16 and the trades that lost.
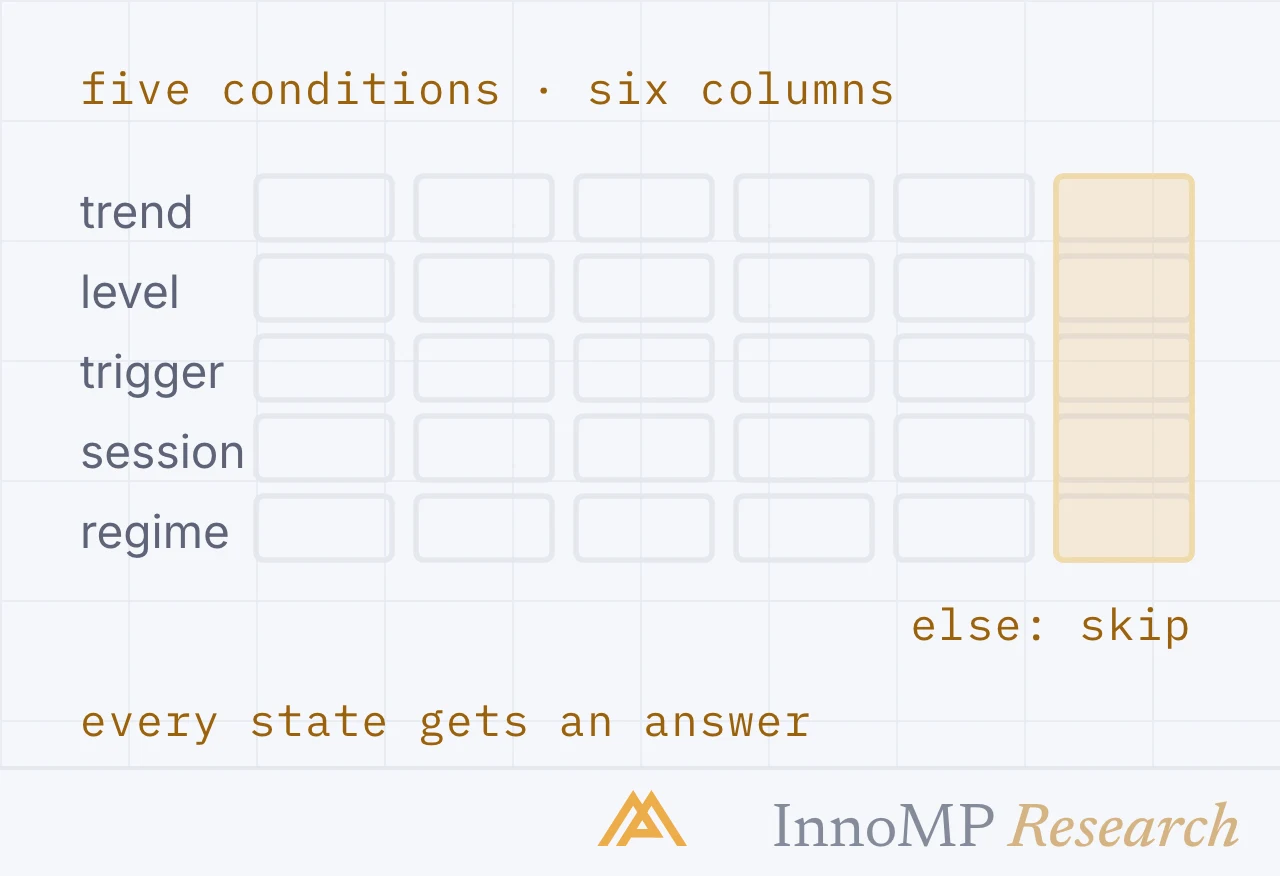
| Column | What goes in it | Why |
|---|---|---|
| Date and hour | When the rules fired | Session analysis later — Part 8 |
| Context | Which filters were true, and how many reasons | Lets the setup be split by confluence count afterward |
| Trigger | Which event, at what price | Confirms the same trigger was used every time |
| Stop and target | Prices, and the R the target implied | Expectancy needs the planned R, not the outcome |
| Filled | Yes, or no and why | The retest entry’s hidden cost lives here |
| Result | In R, at the stop or target, or a scratch | The number everything else is computed from |
From the rows come four numbers: win rate, average win in R, average loss in R, and their combination, the expectancy per trade. And one more that is not an average: the longest run of consecutive losses.
How big the sample has to be
A win rate from a small record is not a measurement. It is a guess with a number attached, and the width of the guess is arithmetic.
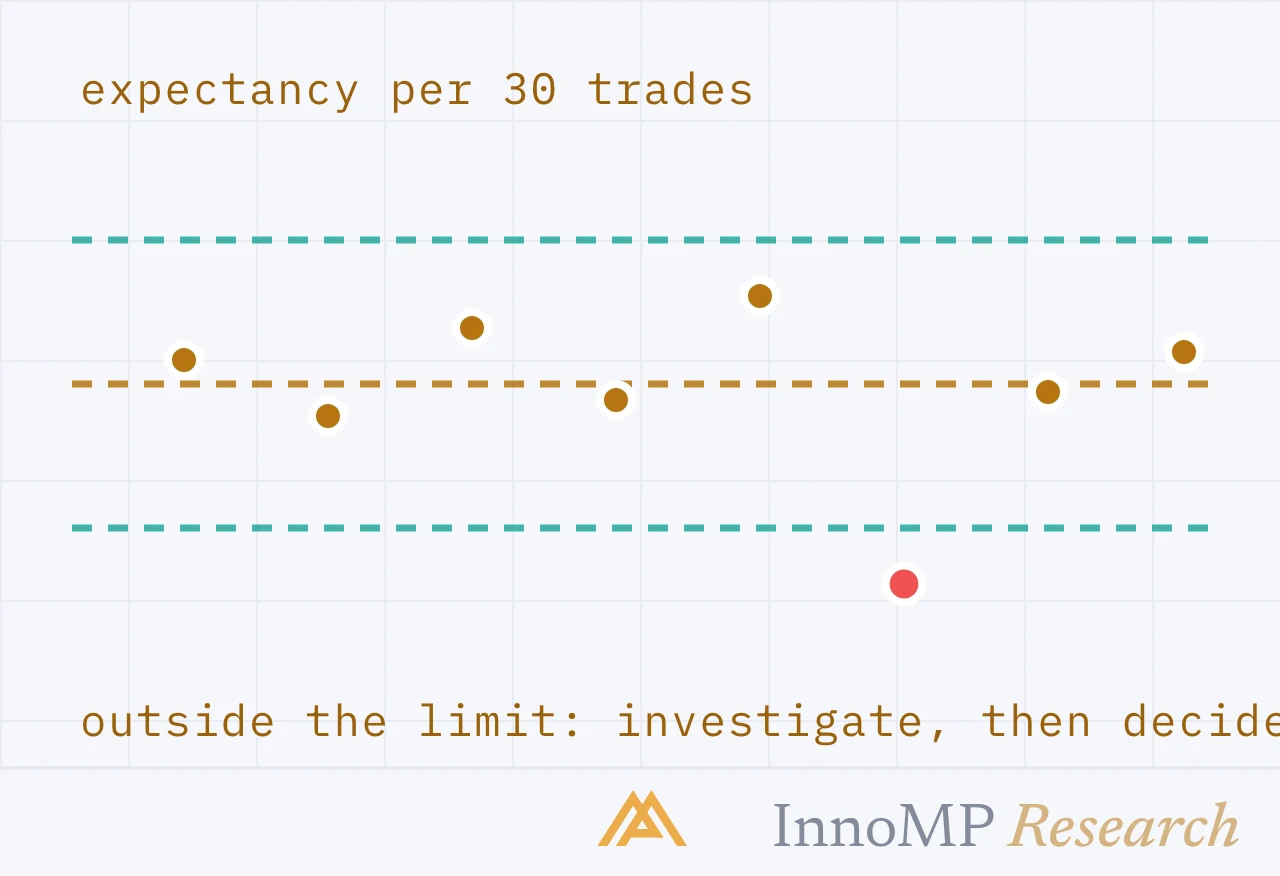
The figures come from the standard interval for a proportion — the estimate plus or minus about two standard errors, where the standard error is the square root of p(1−p)/n. At thirty trades and a true rate of one half, that is roughly eighteen points either way; at a hundred, ten; at three hundred, six. The interval shrinks with the square root of the sample, which is why the second hundred trades help less than the first and the third less again.
Two consequences. A setup that fires three times a week needs about a year of replayed charts to reach a sample whose win rate can be read to within ten points. And a difference of a few points between two versions of a setup — two triggers, two management rules from Part 17 — is not a difference at all until the samples are large enough to resolve it. Overconfidence and luck in Foundations was this arithmetic seen from the psychological side.
Key takeaway A record of thirty trades cannot tell a 45% setup from a 55% one, and those are different businesses. The sample is not a formality before trusting the numbers. It is what makes them numbers.
The losing run
Averages hide the thing that ends accounts. A setup with a 45% win rate will, over a few hundred trades, produce runs of six, seven, eight losses in a row — not as a failure, but as ordinary variance. Reading a drawdown in Foundations gave the arithmetic; the record gives the observed run.
The longest run in the record is a floor, not a ceiling: a larger sample will contain a longer one. Six in a row at 1% each is a 6% drawdown before the recovery arithmetic starts; the psychology part said what that feels like, and the size the setup is traded at has to be one the trader can hold through a run somewhat longer than the record’s worst. That decision is made here, with the record, not in the seventh loss.
What the replay hides
A backtest measures the rules. It does not measure the trader, the spread, or the clock — and all three are in the live result.
A forward test keeps the same record in real time on a demo account: the same rows, the same columns, with the trades taken as the candles actually close. It is slow — a setup that fires three times a week yields a dozen rows a month — and it is where the replay’s optimism is corrected. Triggers fire while the trader is away. The rollover widens the spread across a stop. A news candle does in one minute what the replay showed happening over an hour. And the hesitation Foundations described turns a valid trigger into a late entry that the backtest never had to price.
The two records are read together. Where the forward test’s numbers track the backtest’s, the setup has survived contact with reality. Where they diverge, the gap is the trader, the costs or the clock — and that gap is the next thing to work on, because the rules were already fine.
What “works” means
A setup works when three things are true in the record at once, and not before.
Positive expectancy after costs. The average trade, in R, is above zero once spread and swap have been taken out — which for a setup with a small edge on a short timeframe is where most of the edge goes.
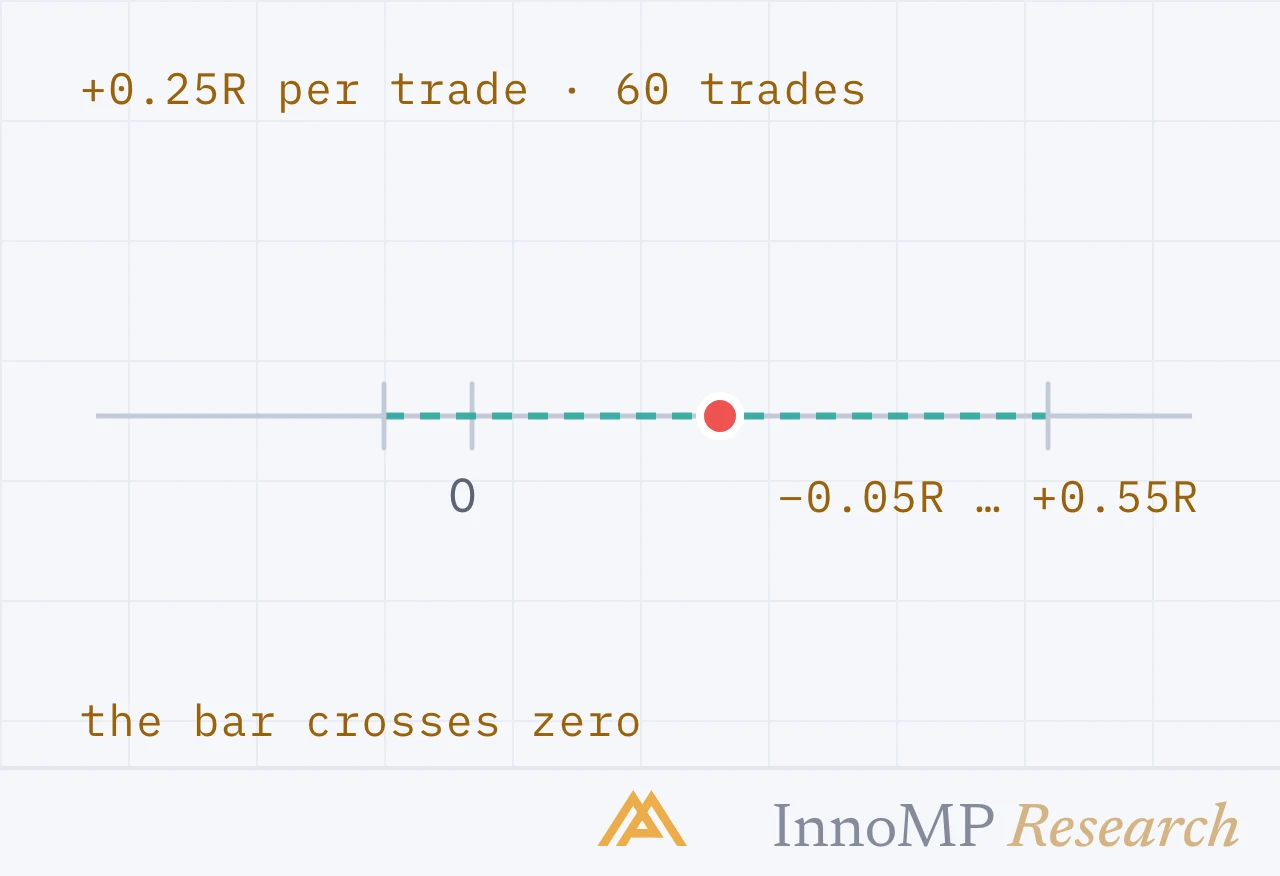
A sample that can bear it. Large enough that the interval around the win rate does not include the break-even rate for the setup’s R. A record whose interval straddles zero expectancy has not yet said anything.
A survivable worst run. The longest losing run, at the intended size, produces a drawdown the trader will sit through without changing the rules. The process-versus-outcome part of Foundations was about exactly this: a setup that is abandoned in its ordinary variance has no expectancy at all, whatever the record says.
Where the level ends
Eighteen parts. The first group read one market on three charts in a fixed order, and settled who decides when the charts disagree. The second asked who was there — what tick volume measures, and where it speaks loudest. The third read the clock: the day’s three opens, the levels each day leaves behind, and the server that decides what a day is. The fourth looked sideways, at what moves together, the leg every major shares, and the arithmetic of positions that overlap. And this group put the pieces on a card, priced the entry, priced the management, and put the card through a notebook before an account.
That notebook is where the Intermediate level hands over. Everything it produces — win rate, R, the worst run, the gap between replay and forward test — is a number about a discretionary process. The Professional level is about what to do with those numbers: validating an edge statistically, reading volatility regimes and microstructure, and turning a process that works into one that can be run.
Continue with Level 3: Technical Analysis: Professional — it starts with how a price is actually made. · Return to the series index
- A manual backtest applies the written rules to past candles one at a time, without seeing what comes next.
- The record holds, for every trade: date, context, trigger, stop, target, and the result in R — including the setups that fired and were not filled.
- A win rate measured over 30 trades can sit around 18 percentage points from the setup's true rate; over 300 trades, about 6.
- The longest losing run in the record is a lower bound on the drawdown the setup will produce.
- A forward test on a demo account is the same record kept in real time, and it catches what the replay hides.