Skip to content
Research / Education / Market structure

TA · Intermediate · Part 1 of 18

Top-down analysis: reading three timeframes in a fixed order

Direction from the higher chart, the setup on the trading chart, the trigger from the lower one — and why the order is the whole method. Level 2 of the technical analysis course starts here.

InnoMP Research · Education Desk Published 19 Sept 2026 · Updated 19 Sept 2026 8 min read
InnoMP Research cover art — one question per chart
In short

Top-down analysis reads a market on three timeframes in a fixed order. The higher timeframe sets the directional bias, the trading timeframe finds a setup in that direction, and the lower timeframe times the entry. Each chart answers one question and is never asked the others. The order matters because it stops the lower chart, which changes most often, from overruling the higher chart, which carries the most participation.

Top-down analysis is reading a market on three timeframes in a fixed order: the higher chart for direction, the trading chart for a setup, the lower chart for the entry. Each chart is asked one question and never the others.

Part 3 of Foundations gave each timeframe a job. This part turns those jobs into a procedure — because the jobs only work when they are done in order, and most of what goes wrong with multiple timeframes goes wrong because the order was reversed.

Why the order is the method

The three charts do not carry equal weight. A daily candle summarises a day’s participation; an hourly candle summarises a slice of it. When the two disagree, the daily is not “more right” as a matter of opinion — it is describing more of the market.

So the higher chart is read first, and what it says is settled before the next chart is opened. The lower chart is then read inside that conclusion, never against it.

The three-step order of top-down analysis Three stacked panels connected by downward arrows. The top panel, labelled higher timeframe, asks which way and where the levels are, and is read once before the session. The middle panel, labelled trading timeframe, asks whether there is a setup in that direction, and is read when price nears a level. The bottom panel, labelled entry timeframe, asks when exactly to enter, and is read only after the middle panel says yes. 1 · Higher timeframeWhich way, and where are the levels?read once, before the session2 · Trading timeframeIs there a setup in that direction?read when price nears a level3 · Entry timeframeWhen exactly — the triggerread only after step 2 says yesone question per chart, in this order InnoMP Research
Three questions, three charts, one order. Each step is opened only when the one above it has answered.

Two things follow from the order that are easy to miss.

The higher chart is read rarely. Its answer changes when a candle closes on it, which on a daily chart is once a day. Re-reading it every hour does not add information — it adds opportunities to talk yourself out of a correct bias.

The lower chart is not opened until there is a reason to. Step 3 exists to time an entry the first two steps have already justified. Opening the 15-minute chart “to see what it is doing” without a setup on the trading chart is how trades get invented.

Step 1 — the higher timeframe: direction and levels

The higher chart answers one question: which way, if any, does structure point?

The tool is market structure. Higher highs and higher lows in order mean the bias is long. Lower highs and lower lows mean it is short. A mixed sequence means there is no bias — and no bias is a real answer, not a failure to find one.

Step 1: the daily chart sets the directional bias A rising daily price line with its higher highs marked HH and higher lows marked HL. A dashed level extends to the right from the most recent higher low, labelled last HL, with a note that the bias is long while price holds above it. HHHHHHHLHLlast HLlong above itStep 1 · Dailyhigher highs and higher lows, in order InnoMP Research
Structure is rising, so the bias is long — and the last higher low is the level that would change that verdict. Both facts are carried to the next chart.

Two things are written down before moving on: the bias, and the level that would cancel it. In an uptrend that level is the last higher low. If price closes below it on the daily chart, the bias is gone and the procedure starts again from Step 1.

The levels themselves — which ones to carry down, and how to draw them on a smaller chart — are the subject of Part 2.

Step 2 — the trading timeframe: is there a setup?

The trading timeframe is the chart the trade is planned on: where the entry zone, the stop and the target are decided. Its question is narrower than Step 1’s. Not “which way?” — that is settled — but “is price offering an entry in that direction, here, now?”

For a long bias that usually means one of the things Foundations covered: a pullback to a level, a retest of a broken one, or a continuation pattern resolving upward.

Step 2: the 4-hour chart, a pullback into the daily level A 4-hour price line rising, then pulling back into a shaded zone labelled as the daily level carried down. The lowest point of the pullback inside the zone is circled and labelled setup, with a note that it is the third touch of a daily level. Daily level, carried downsetupthird touch of a daily levelStep 2 · 4-hourthe pullback reaches the level: a setup InnoMP Research
The daily level from Step 1 is drawn here as a zone. Price pulling back into it, in the direction of the bias, is a setup — the only kind of thing Step 2 is looking for.

If the answer is no — price is mid-range, or nowhere near a level, or moving against the bias with nothing to lean on — the procedure stops here. Most sessions stop here. That is not the method failing; it is the method doing the thing it is for.

Step 3 — the entry timeframe: timing, not opinion

Only when Step 2 has produced a setup does the lower chart get opened, and it gets opened for one purpose: to place the entry more precisely than the trading chart allows.

Inside a pullback, the lower chart shows a small downtrend — lower highs and lower lows, the mirror of the daily’s structure. That is expected, and it is not a reason to doubt the bias. The trigger is the moment that small structure breaks in the direction of the bias: a lower high taken out, a close back above a level.

Step 3: the 1-hour chart inside the pullback, and the trigger A 1-hour price line making lower highs and lower lows inside the pullback, each lower high marked LH. A dashed line extends from the last lower high. Price then rises through that line, and the crossing is circled and labelled trigger. LHLHLHtriggertrigger: break of the last lower highStep 3 · 1-hourinside the pullback, lower highs and lows InnoMP Research
The lower chart shows the pullback as a small downtrend. The trigger is that downtrend breaking — the first lower high taken out. Nothing before that is an entry.

The stop goes beyond the lower-timeframe swing that defined the trigger, with a buffer, exactly as stop placement described. The target comes from the trading chart — the prior swing high, or a measured move — not from the entry chart, which has no view long enough to set one.

Key takeaway The lower chart is allowed to say when. It is never allowed to say whether. Direction was decided two charts up, and nothing the 1-hour chart does can reopen that question.

Choosing the three

The Foundations rule still holds: charts roughly four to six times apart, so that each one genuinely shows something the others do not. Closer than that and two of the three are the same picture; further apart and the middle one stops connecting them.

Trading styleHigher (direction)Trading (setup)Entry (trigger)
Position, weeksWeeklyDaily4-hour
Swing, daysDaily4-hour1-hour
Intraday, hours4-hour1-hour15-minute

Pick a row and keep it. The procedure only teaches you something if the same three charts are read the same way every time — and the journal can only show a pattern in your reads if the reads were made under one rule.

The order protects you from yourself

Reverse the order and the same three charts produce a different method — one Foundations already named: timeframe shopping.

Bottom-up reading versus top-down reading Two columns. The left column, labelled bottom-up, lists seeing a move on the 15-minute chart, looking for a reason, finding one somewhere, and trading it, with the result that you find the chart that agrees with you. The right column, labelled top-down, lists daily for direction, 4-hour for a setup, waiting when there is none, and 1-hour only when there is, with the result that the entry has to earn its place, in order. Bottom-up1 · a 15-min move2 · look for a reason3 · find one somewhere4 · trade itresultyou find the chartthat agrees with youTop-down1 · daily: direction2 · 4-hour: setup?3 · no setup: wait4 · setup: 1-hourresultthe entry has to earnits place, in order InnoMP Research
Same charts, opposite order, different method. Bottom-up starts from a trade and looks for permission; top-down starts from the market and may never reach a trade.

Bottom-up feels like diligence — you looked at three charts, after all. But the search was for a reason to do something already decided, and with three charts and a dozen indicators a reason can always be found. Confirmation bias does not need help; the reversed order gives it a procedure.

Top-down cannot be gamed the same way, because the first chart is read before there is a trade to want.

One complete read

Put the three steps together on one instrument.

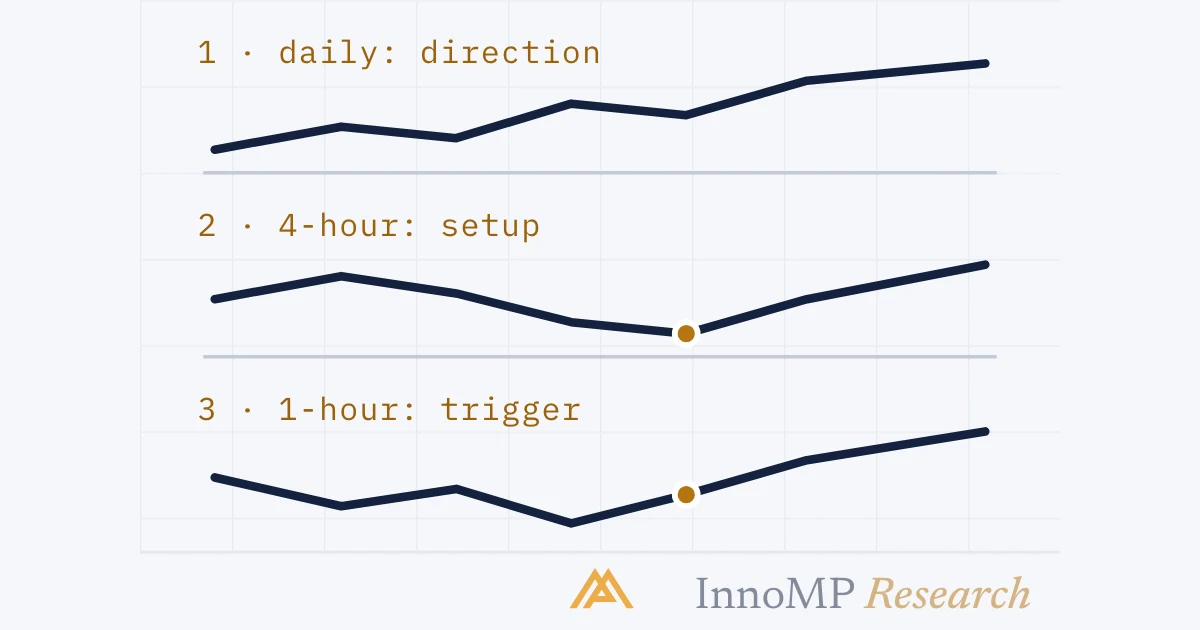
One complete top-down read, on three stacked panels Three stacked panels. The top, labelled daily with bias long, shows higher highs and higher lows with a level below price. The middle, labelled 4-hour setup, shows a pullback into that level, with the third touch circled. The bottom, labelled 1-hour trigger, shows lower highs breaking upward, with the break circled and a note that the stop goes under the 1-hour low. Daily · bias longhigher highs, higher lowsa level below price4-hour · setuppullback into the levelthird touch — a setup1-hour · triggerlower highs break upwardstop under the 1-hour lowsame market, three questions, one order InnoMP Research
Daily: rising, level below. 4-hour: pullback into the level. 1-hour: the pullback's own structure breaks upward. Three questions answered in order, and only then a trade.

In words: the daily is making higher highs and higher lows, so the bias is long, and the last higher low is the level. On the 4-hour, price has pulled back into that level for the third time — a setup. On the 1-hour, the pullback’s own lower highs have just been broken — the trigger. The stop sits under the 1-hour swing low with a buffer; the target is the daily high. The position size calculator turns the stop distance into lots.

Notice how much of the read was refusal. Any of the three steps could have ended it, and on most days one of them does.

Next: Higher-timeframe levels — which daily levels to carry down to the trading chart, and why they are zones rather than lines when you get there.

Key facts
  • Top-down analysis reads the higher timeframe first, the trading timeframe second and the entry timeframe last.
  • Each timeframe answers one question only: direction, setup, or entry timing.
  • A lower timeframe never overrules a higher one on direction.
  • The higher timeframe is read once per session; the entry timeframe is opened only after a setup exists.
  • Reading the same three charts in the opposite order is timeframe shopping — finding the chart that agrees with a trade already wanted.
Frequently asked questions

What is top-down analysis in trading?

A way of reading a market on several timeframes in a fixed order, from the highest to the lowest. The higher chart decides direction, the middle chart finds a setup in that direction, and the lowest chart times the entry. The order is the method: each chart is asked one question and never the others.

Which timeframes should I use for top-down analysis?

Three charts roughly four to six times apart. Weekly, daily and 4-hour for slow trading; daily, 4-hour and 1-hour for most swing trading; 4-hour, 1-hour and 15-minute for intraday. The exact numbers matter less than keeping the gap between them, so that each chart genuinely shows something the others do not.

How often should I check the higher timeframe?

Once, at the start of the session, and again only when a candle closes on it. Its reading changes slowly by construction. Re-reading it every hour invites you to see a change of direction in what is just a pullback.

What is a directional bias?

The direction, long or short, that the higher timeframe's structure supports — or no direction at all when it is ranging. It is set before looking at the trading chart and is not changed by anything seen on a lower one.

What if the lower timeframe looks better in the other direction?

Then there is no trade. A lower chart that disagrees with the higher one is showing the inside of a pullback, and the pullback is the setup for the higher direction, not a signal against it. The one exception — a higher-timeframe reversal — is covered in Part 4 of this level.

InnoMP Research · Education Desk

Trading education from first principles — position sizing, risk, market structure and the habits that keep accounts alive. Written for someone who has never opened a chart, with a diagram at every step.

Published 19 Sept 2026 · Updated 19 Sept 2026

Disclaimer: This content is provided for general informational purposes only and does not constitute investment advice, an offer, or a solicitation to buy or sell any financial instrument. It has been prepared without regard to your individual financial circumstances or objectives. Trading CFDs involves a high risk of loss.

Related notes

InnoMP Research cover art — every major, one leg
Market structure

The dollar leg: why the major pairs are often one trade

The dollar is on one side of 88% of all FX trades, and every major pair has it as a leg. Most of what a major does is the dollar doing it. What the dollar index measures, and how to tell a euro move from a dollar move.

8 min read