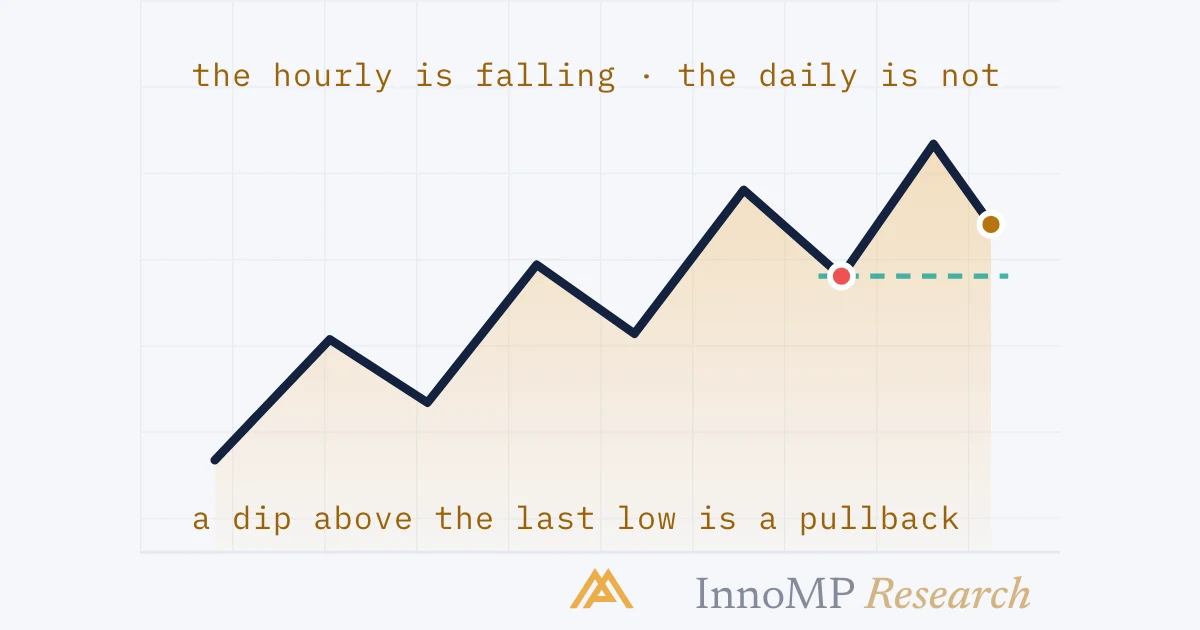
When a lower timeframe moves against the higher one, the default reading is a pullback: the lower chart is showing the inside of a dip the higher chart treats as a candle or two. That holds while the higher timeframe's structure is intact — its last higher low unbroken in an uptrend. It stops holding when the higher chart itself prints the two events that end a trend: a lower high, then a close below the prior higher low. Until both happen there, the disagreement is a setup, not a reversal.
A timeframe conflict is the lower chart pointing one way while the higher chart points the other. By default it is a pullback. It becomes a reversal only when the higher chart’s own structure breaks.
Part 1 said the lower chart never overrules the higher one. This part is about the moment that rule is hardest to keep — when the lower chart is clearly, persuasively falling — and about the one situation in which the higher chart genuinely has changed its mind.
The default is pullback
Foundations made the point once: a falling 15-minute chart inside a rising daily chart is not a contradiction. The lower chart is showing the inside of a dip that the daily draws as one or two candles.
So the first response to a conflict is not to resolve it. It is to recognise that a pullback is what Step 2 of the procedure was waiting for — the lower chart falling toward a higher-timeframe level is the setup arriving, not the bias failing. Most conflicts end this way, and the trader who reads them as reversals sells the dip they were supposed to buy.
The test lives on the higher chart
Whether a pullback has become something else is decided where the bias was decided: on the higher chart, by the two-step test from swing highs and lows. An uptrend ends when the higher chart prints a lower high, and then a close below the prior higher low. In that order. Both of them.
Note what the test does not use: how far the lower chart fell, how fast, how many lower lows it made, what any indicator on it says. None of those is a higher-timeframe event. The lower chart is allowed to be dramatic; the verdict is read from candles that close once a day.
The close, not the wick. An hourly wick below the daily higher low is not a daily close below it. The daily candle that contains the wick has not finished. Reading a daily break from an intraday wick is the most common way a valid bias gets abandoned at the bottom of its own pullback — the stop-hunt from Foundations does exactly this to the level, and then price returns.
Reading the depth
The lower chart cannot change the bias, but it can say how much of the pullback has been used up — where price is inside the daily swing from the last higher low to the last higher high.
| Where the lower chart is | Read | What it changes |
|---|---|---|
| Upper half of the daily swing | Ordinary pullback | Nothing. Wait for a level and a trigger |
| Lower half, above the higher low | Deep pullback | The setup is close to its own invalidation — the stop will be tight and the trade is late |
| Below the higher low, intraday | Undecided | No new longs until the daily closes. A close back above is a stop-hunt; a close below is event two |
Depth is information about the trade — its stop distance, its lateness — not about the bias. A deep pullback is still a pullback. It is a worse entry, and the position size calculator will say so through the stop distance, but it is not a reversal until the daily says it is.
A lower-timeframe break is not a higher-timeframe break
The confusion that causes most of the damage: the 1-hour chart prints a break of structure and the trader reads it as the trend changing. It is a change — at 1-hour resolution. Which way it breaks decides what it means.
Upward — the pullback’s small downtrend breaks in the direction of the daily bias. That is the trigger from Part 1, Step 3. The conflict has resolved the way conflicts usually do: the lower chart has rejoined the higher one.
Downward — the pullback makes a new lower low. It is deeper than it was. Consult the depth table: is it still above the daily higher low? Then it is a deeper pullback, and Step 2 waits. Has it gone below intraday? Then wait for the daily close. At no point has the 1-hour chart been asked whether the daily trend is over, because it cannot answer.
Key takeaway The chart that set the bias is the only chart that can remove it. A conflict is read as “where inside the higher trend are we?” — never as “which chart is right?” — because the higher chart is right by construction until its own structure says otherwise.
When the higher chart really is reversing
Sometimes the second panel of the daily figure is what happens. The bias does not flip in one move; it passes through a state where it is neither.
After the lower high — the bias is in question. Open positions stay on their stops; they were placed at the invalidation, and the invalidation has not been hit. New trades in the old direction stop, because the first event has printed and the second may follow. New trades in the other direction do not start either — a lower high alone is not a downtrend.
After the close below the higher low — the bias is gone. The procedure restarts at Step 1 with a fresh read: the daily may now be making lower highs and lower lows, or it may be ranging. Either way the old bias is not carried forward, and neither are the levels that belonged to it — Part 2’s map is redrawn.
Everything the lower chart showed during the pullback now inverts in meaning. The 1-hour downtrend that was “the inside of a dip” was, in hindsight, the beginning. That is only visible afterward, which is why the rule does not try to see it beforehand.
Counter-trend trades, priced honestly
A counter-trend trade is a trade against the higher-timeframe bias — shorting the pullback in a daily uptrend, on the lower chart’s evidence. Some plans allow it. None should allow it unpriced.
The arithmetic is built in. The target is the nearest higher-timeframe level — in a pullback, the last higher low — and it is close. The real invalidation is the higher-timeframe swing that would have to break for the trade to be wrong, and it is far. A stop placed closer than that is a stop inside the noise, which Foundations already priced. So a counter-trend trade starts with a risk-reward ratio below one, and has to be won unusually often to pay.
That does not make it forbidden. It makes it smaller and rarer: a fraction of standard risk, only where the plan names it, and only with a target that was there before the trade — never “as far as it goes.” A trader whose journal shows counter-trend trades doing as well as trend trades has learned something worth knowing. Most journals do not show that.
Where this group ends
Four parts, one procedure. The higher chart sets the bias and the level that would cancel it. Those levels come down to the trading chart as zones with reasons. Trades are ranked by independent reasons, counted against a number decided in advance. And when the charts disagree, the higher one is read for the answer — because it is the only chart whose structure the bias was ever built on.
The next group asks a question none of these charts can answer on their own: not where price went, but who was there when it did.
Next: Tick volume in forex and CFDs — what the bar under a currency chart actually counts, and what participation can and cannot tell you in a CFD market.
- A lower timeframe moving against the higher one is, by default, a pullback.
- The bias changes only when the higher timeframe's own structure breaks: a lower high, then a close below the prior higher low.
- A lower-timeframe break of structure is a trigger inside the higher trend, not a change of the higher trend.
- A timeframe conflict is resolved on the higher chart, never on the lower one.
- A counter-trend trade has a near target and a far invalidation by construction, which is why it is priced before it is taken.