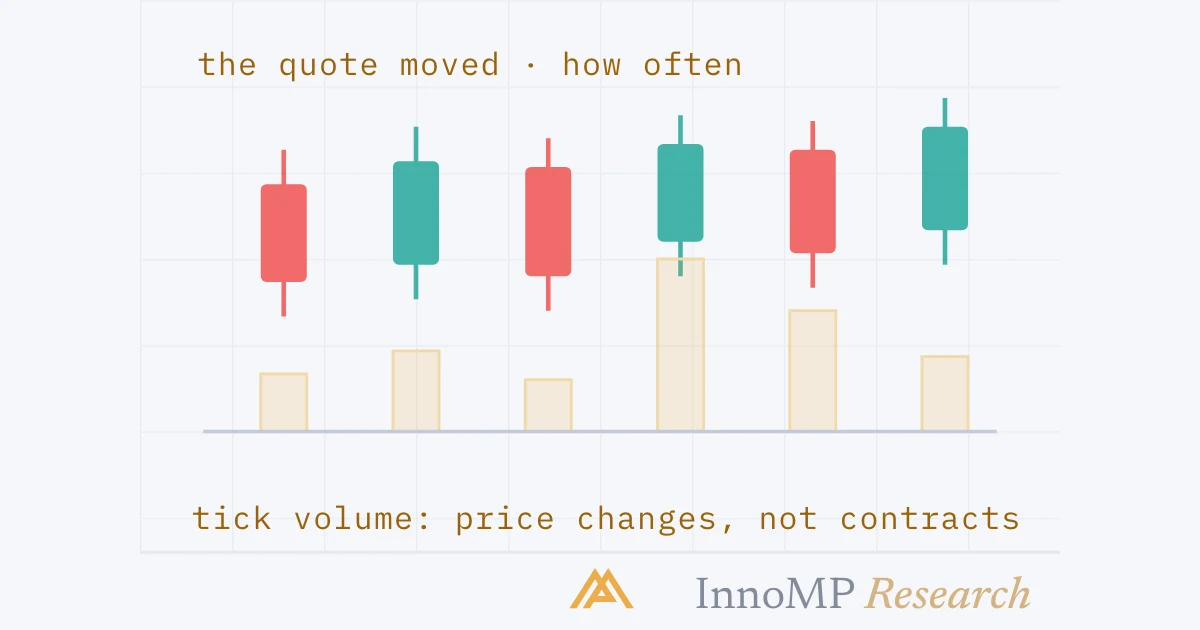
Tick volume is the number of price changes inside a candle's period. On a forex or CFD chart it stands in for volume because the market is over-the-counter: there is no central exchange to count contracts, and each broker sees only its own flow. Tick volume measures activity, not size or direction, so it is read relative to the candles around it and to the same hour on previous days, never as an absolute number. It is most useful at the moments the price chart leaves ambiguous — a breakout, a level, a wide candle.
Tick volume is the number of times the price changed during a candle’s period. On a forex or CFD chart it is what the volume bars show — a count of activity, not of currency or contracts traded.
The first group of this level was about where price went, read across three charts. This group asks a question those charts cannot answer on their own: who was there when it did? Volume is the usual answer, and in a currency market the usual answer has a complication that has to be understood before it can be used.
Why forex has no volume
On a stock exchange every trade passes through one order book, so the exchange can count them. Volume there is a fact: so many shares changed hands.
Forex does not work that way. It is an over-the-counter market: banks, dealers and brokers trade with each other directly, and there is no central book. The Bank for International Settlements, which measures it every three years, put turnover at 7.5 trillion US dollars a day in April 2022 — and that figure is a survey total, not something any single participant sees. Each venue knows its own flow and nobody knows all of it.
A CFD on EURUSD is priced from that decentralised market, so it inherits the problem. The broker knows what its own clients traded; it does not know what the market traded. The volume bars on the chart therefore cannot be a count of contracts, because no such count exists to display.
What tick volume counts instead
What every platform can count is how many times its quote changed. That is tick volume: a candle in which the price moved 400 times has a tick volume of 400. MetaTrader 5’s documentation says it plainly — for the forex market its Volumes indicator shows the number of price changes within each period, and for stock symbols the actually traded volume. Its data structure keeps the two apart as separate fields, tick volume and real volume, which is worth knowing because on a CFD feed the second is often empty.
Two candles can have the same open, high, low and close and very different tick volume. One was fought over — the quote flickered hundreds of times as orders met — and the other drifted to the same place in a dozen moves. Candlestick anatomy cannot see that difference. The bar can, and that is its entire value.
What it can tell you
Tick volume measures participation — how much activity a period contained — and participation is what several of this level’s questions come down to.
- Was a move traded, or did it drift? A breakout that the quote flickered through hundreds of times had participants behind it; one that gapped through in a few ticks did not. That is Part 6.
- Did a lot of activity produce very little movement? Heavy participation that fails to move price is the other side absorbing it. That is Part 7 of this level.
- What does the day look like? Activity has a rhythm by hour, and the rhythm is the baseline everything else is read against.
That last point is where the session material from CFD Foundations becomes measurable. The BIS survey’s breakdown of where trading is intermediated explains the shape:
| Location of the sales desk | Share of global FX turnover, April 2022 |
|---|---|
| United Kingdom | 38% |
| United States | 19% |
| Singapore | 9% |
| Hong Kong SAR | 7% |
| Japan | 4% |
Five centres handle 78% of it, and the two largest are London and New York. Tick volume by hour draws the same picture on every currency chart.
Relative, never absolute
Because the count depends on the hour, and on the broker’s feed, a tick-volume number means nothing on its own. It means something against a baseline — and choosing the wrong baseline is the most common way volume gets misread.
Two rules follow.
Compare with the same hour on recent days. The question is never “is this bar big?” but “is this bar big for 09:00?” A candle that is unusual for its own hour is information. A candle that is merely the London open is the clock.
Compare only within one chart. A tick count on one broker’s platform is not comparable with the count on another’s — different liquidity providers, different tick filtering, different quotes. The baseline is the chart’s own history and nothing else.
Key takeaway Tick volume is a relative measure of activity, read against the same hour on previous days. Used that way it answers “was this candle unusual?” Used as a number, it answers nothing.
What it cannot say
The limits are as important as the uses, because tick volume is often read as if it were exchange volume.
No direction. A price change is a price change. Tick volume does not know whether the tick was a buyer lifting the offer or a seller hitting the bid, so it cannot be split into buying and selling volume however a platform labels it.
No size. One tick can be a single small order or a very large one. A busy candle is a candle with many changes, which is not the same as a candle with a lot of money in it.
No cross-broker meaning. Covered above, and worth repeating because “volume was huge” is a claim people make about a market when they are describing one feed.
Nothing during news. In the minutes around a scheduled release the quote updates continuously whatever is happening, so tick volume saturates. It confirms that the release happened, which the economic calendar already said.
Real volume, where it exists
Not every CFD is priced from an over-the-counter market. Index, stock and commodity CFDs are priced from instruments that trade on exchanges, where real volume exists — and a broker’s feed may or may not pass it through.
| Underlying | Market | What the volume bar counts |
|---|---|---|
| Currency pairs | Over the counter | Tick volume |
| Spot gold and silver | Over the counter | Tick volume |
| Indices, stocks, commodities | Exchange-traded underlying | Tick volume by default; real volume if the feed carries it |
On MetaTrader 5 the Volumes indicator has a parameter that chooses between tick and real volume. If real volume is selected and the bars show zero, the feed does not carry it for that symbol, and the reading has to come from ticks like everywhere else. Where real volume is present, everything in this group applies to it more strongly, not less — it has size and it has a single count.
Next: Volume at breakouts and climaxes — the two moments participation matters most: when price leaves a range, and when a move runs out.
- Tick volume counts price changes in a period; real volume counts units actually traded.
- Forex is an over-the-counter market with no central exchange, so no consolidated volume exists. The BIS measured its turnover at 7.5 trillion US dollars a day in April 2022.
- MetaTrader 5's Volumes indicator counts price changes for forex and actual traded volume for exchange-listed stocks.
- Tick volume is read against the same hour on previous days, not as an absolute number.
- Tick volume says how busy a candle was; it says nothing about who was buying or how large the orders were.