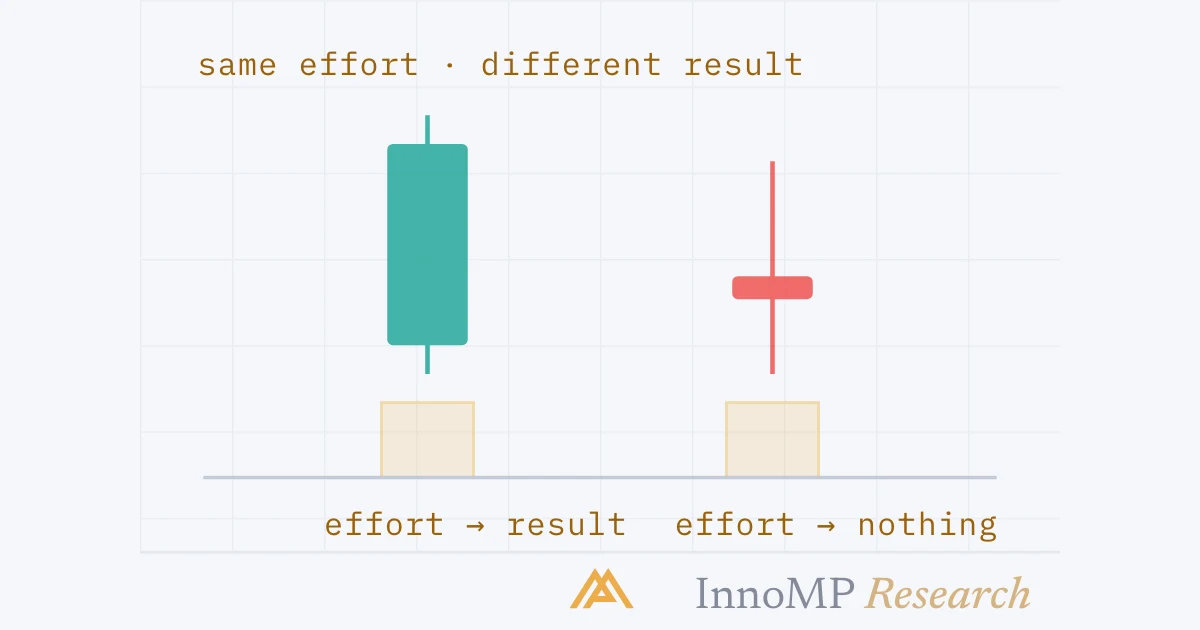
Effort versus result reads volume as the effort and the price change it produced as the result. When they agree — heavy participation, a wide candle — the move is in harmony and likely to continue. When heavy participation produces a small candle, the orders are being absorbed by the other side, which at a level is evidence it is holding. When light participation produces a wide candle, the market was thin and the move carries little information. From the Wyckoff method; read one candle, or one leg, at a time.
Effort versus result reads volume as the effort participants put in, and the price change it produced as the result they got. When the two agree, the move is being paid for. When they disagree, the disagreement is the information.
Part 6 applied volume at two specific moments. This part is the general rule those moments were instances of. It comes from the Wyckoff method, where it is the third of three laws, and it is the reading that makes the volume bar useful on any candle — not only at a break or a climax.
The four combinations
Effort can be heavy or light. Result can be large or small. That gives four readings, and each has a name.
Two of the four are unremarkable. Heavy effort with a large result is a market doing what markets do; light effort with a small result is a market doing nothing. The two off-diagonal cells are where volume says something price does not.
Harmony: the move is being paid for
Start with the ordinary case, because the others are read against it.
This is the Dow reading from Part 6 at the resolution of a single candle: participation arriving and price responding to it. It is confirmation of nothing in particular — it is simply the trend behaving — and its value is as a baseline. When a candle fails to look like this, one of the next two readings applies.
Absorption: heavy effort, small result
A tall bar under a candle with a small body. A great deal was traded and price barely moved. Someone was selling everything the buyers brought — or buying everything the sellers brought — at that price, and the orders were absorbed.
Where this happens matters. Absorption in the middle of nowhere is a pause. Absorption at a higher-timeframe level — the zone Part 2 carried down — is the level doing its job, and it is visible a candle before the reaction the price chart needs. The wick that candlestick anatomy called the rejected part of the candle is, with a tall bar under it, a wick that was traded — the rejection had participants.
Two things absorption is not.
It is not a direction. Heavy effort with no result says the orders were met. It does not say by whom. In a downtrend arriving at support, the natural reading is that buyers absorbed the selling; but a tall bar with a small body at resistance in an uptrend is sellers absorbing the buying, and the shape is identical. The level and the bias supply the direction; the bar supplies only “something was met here.”
It is not yet a reaction. It is evidence for one. The confirmation sequence from Part 2 — the wick, the higher low, the break of the last minor high — still has to follow. Absorption is a reason to expect it, counted as one reason.
The thin market: light effort, large result
The other off-diagonal cell. A wide candle over a tiny bar: price travelled a long way and almost nobody traded it.
The path was empty. With few orders resting, a modest amount of buying met no resistance and travelled further than its size deserved. The market did not decide anything at those prices; it passed through them because nobody was there to object.
This is the Asian session reading from CFD Foundations, made measurable, and it also describes the minute after a news release once the initial burst fades. A move made in a thin market is not wrong, but it is unconfirmed by construction — and the standard behaviour is for participation, when it returns, to retest the ground the thin move covered. A breakout in these conditions is the “break on nothing” of Part 6.
Key takeaway Absorption is a lot of trading that went nowhere: something was decided at that price. A thin move is a lot of travel with no trading: nothing was decided at those prices. The first is worth acting on at a level; the second is worth waiting out.
Reading it at the reaction
Part 2 gave the reaction at a higher-timeframe level three steps. Put the bars under them and each step has an expected effort.
The wick — heavy. The rejection candle should be the absorption candle: a tall bar, a small body, a wick into the zone. A wick on a light bar is a candle that touched the zone when nobody was trading, which is the thin-market cell, and it proves less.
The higher low — light. The pullback after the rejection should be quiet. Sellers had their chance at the level and were met; the dip that follows is what it looks like when they do not try again. A higher low on heavy volume is a second attempt — absorption again if it holds, but not yet the quiet that says the selling is over.
The break — rising. The candle that takes out the last minor high should carry participation, for the reason Part 6 gave: a break that was traded has defenders.
Three readings, three different cells of the grid, in an order. The price chart alone gave the reaction its shape; the bars say whether each step was populated.
Over a leg, not only a candle
The same comparison works across a whole leg of a trend, and this is the form Wyckoff describes: effort and result over a swing, compared with the swing before it.
Each leg is bought as heavily as the last and gains less. That is heavy effort with a shrinking result — absorption, spread across a trend rather than concentrated in a candle — and the Wyckoff tutorial calls it inharmonious action: an early warning of a possible change in trend. It is the same warning Part 6 found in a pullback being sold on volume, seen from the other side, and it precedes the climax rather than following it.
As with every volume reading in this group, it does not end the trend. Structure does that, on the higher chart, by the test Part 4 set out. What a tiring trend changes is the posture: new entries in the trend direction are held to a higher standard, and the levels the higher chart would need to break are watched more closely.
Where the reading fails
Every limit from Part 5 applies. Effort here is tick volume — a count of price changes, read against the hour — so a “heavy” bar is heavy for its hour, not heavy in any absolute sense, and a comparison across a session boundary is a comparison of two clocks. The minutes around news saturate the tick count whatever price does, so the grid does not apply to a news candle at all.
| Reading | Looks like | Ask before acting |
|---|---|---|
| Absorption | Tall bar, small body, wick into a level | Is it at a level with a reason? Heavy for its hour? |
| Thin market | Wide body, tiny bar | Which session? Is participation about to arrive? |
| Harmony | Wide bodies, heavy bars, in step | Nothing — this is the baseline |
| Tiring trend | Legs shortening under equal bars | Where is the higher-timeframe lower high that would confirm it? |
Where this group ends
Three parts, one instrument. Tick volume counts activity, not contracts, and is read against the hour. At a breakout it says whether anyone traded the break; at the end of a move it says when the last of them arrived. And in general it says, one candle or one leg at a time, whether the effort participants put in is producing the result it should — which is the closest a currency chart comes to showing who was there.
The next group turns to when. Most of what this group called “the norm for the hour” is the structure of the trading day, made explicit.
Next: Session opens and the Asian range — how a trading day is structured by its three opens, and what the range Asia leaves behind is worth.
- Effort is volume; result is the price change it produced. The reading compares the two.
- Heavy effort with a small result is absorption: the other side is meeting the orders.
- Light effort with a large result is a thin market: the move carries little information and is often retraced.
- Absorption at a higher-timeframe level is evidence the level is holding, before price has turned.
- The Wyckoff method treats a divergence between volume and price as an early warning of a change in trend.